Tag Archives: ggmap

How Big Is The Vatican City?

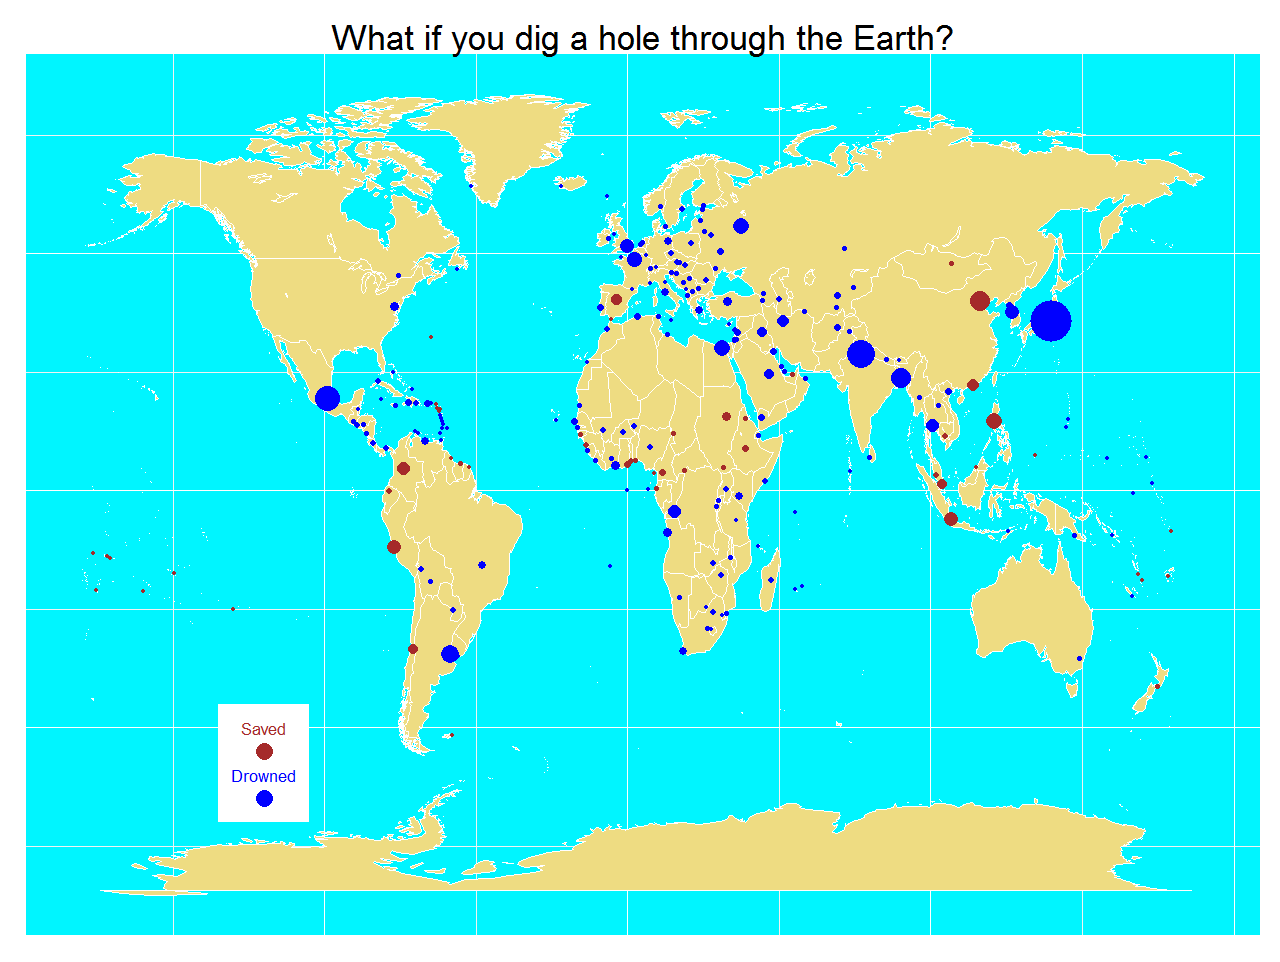
Dici che il fiume trova la via al mare e come il fiume giungerai a me (Miss Sarajevo, U2)

One way to calculate approximately the area of some place is to circumscribe it into a polygon of which you know its area. After that, generate coordinates inside the polygon and count how many of them fall into the place. The percentage of coordinates inside the place by the area of the polygon is an approximation of the desired area.

I applied this technique to calculate the area of the Vatican City. I generated a squared grid of coordinates around the Capella Sistina (located inside the Vatican City). To calculate the area I easily obtain the convex hull polygon of the coordinates using chull function of grDevices package. Then, I calculate the area of the polygon using areaPolygon function of geosphere package.

To obtain how many coordinates of the grid fall inside the Vatican City, I use revgeocode function of ggmap package (I love this function). For me, one coordinate is inside the Vatican City if its related address contains the words “Vatican City”.

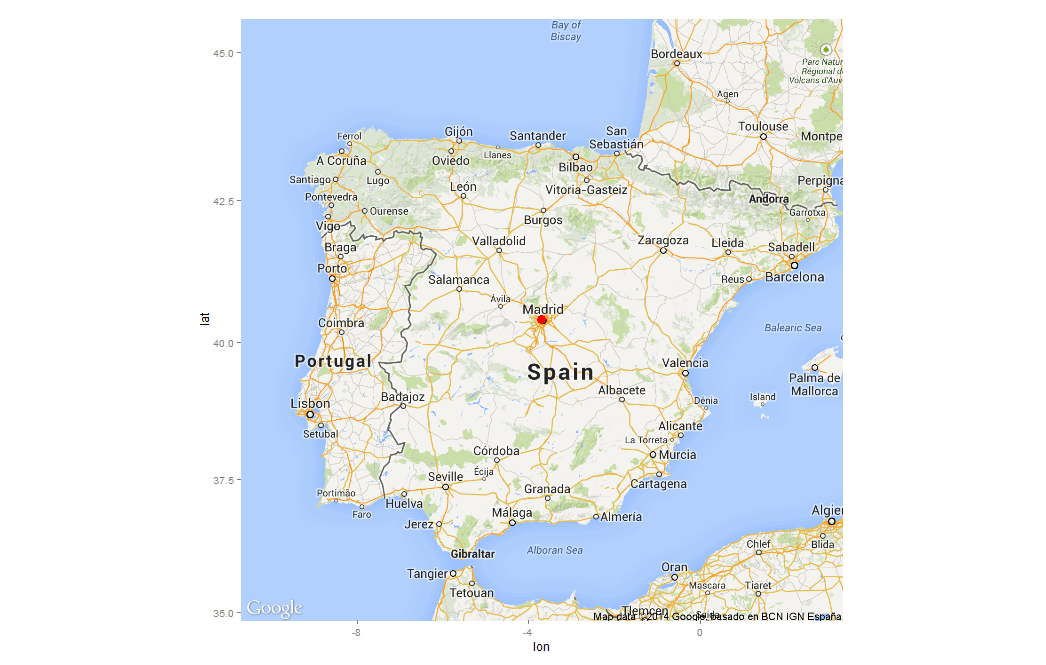
What happens generating a grid of 20×20 coordinates? I obtain that the area of the Vatican City is about 0.32Km2 but according to Wikipedia, the area is 0.44Km2: this method underestimates the area around a 27%. But why? Look at this:

Vatican2

This plot shows which addresses of the grid fall inside the Vatican City (ones) and which of them do not fall inside (zeros). As you can see, there is a big zone in the South, and a smaller one in the North of the city where reverse geocode do not return “Vatican City” addresses.

Maybe Pope Francis should phone Larry Page and Sergey Brin to claim this 27% of his wonderful country.

I was willing to do this experiment since I wrote this post. This is the code:

require(geosphere)
require(ggmap)
require(plotGoogleMaps)
require(grDevices)
setwd("YOUR-WORKING-DIRECTORY-HERE")
#Coordinates of Capella Sistina
capella=geocode("capella sistina, Vatican City, Roma")
#20x20 grid of coordinates around the Capella
g=expand.grid(lon = seq(capella$lon-0.010, capella$lon+0.010, length.out=20),
lat = seq(capella$lat-0.005, capella$lat+0.005, length.out=20))
#Hull Polygon containing coordinates
p=g[c(chull(g),chull(g)[1]),]
#Address of each coordinate of grid
a=apply(g, 1, revgeocode)
#Estimated area of the vatican city
length(grep("Vatican City", a))/length(a)*areaPolygon(p)/1000/1000
s=cbind(g, a)
s$InOut=apply(s, 1, function(x) grepl('Vatican City', x[3]))+0
coordinates(s)=~lon+lat
proj4string(s)=CRS('+proj=longlat +datum=WGS84')
ic=iconlabels(s$InOut, height=12)
plotGoogleMaps(s, iconMarker=ic, mapTypeId="ROADMAP", legend=FALSE)

Going Bananas #1: Superman Was Born In Kentucky!

Who knows? Could be the tropic heat or something that I eat, that makes me gonzo (I’m Going Bananas, Madonna)

This is the first post of a new category called “Going Bananas” in which I will post totally crazy experiments. My aim is to try some techniques without taking care of making serious things. These are experiments without rhyme or reason (or, as we say in Spanish, sin pies ni cabeza). So here we go.

Some days ago, my friend Juanjo show me how to download a webpage and to extract a table in R. He did an amazing script to locate on a map all spanish football stadiums in just a handful of lines. And this is what what I will do in this experiment with a slight difference. I will not locate stadiums: I will try to locate the 118 chemical elements discovered up today. How to do it? It is extremely easy: as I did it in this previous post, using geocode function of ggmap package you can locate any address, even if it is the name of a chemical element.

It must be taking into account that almost all names of the elements come from greek or from latin as you can see here. This is the result of locating in the world the 118 chemical elements:

Bananas01

Some conclusions:

  • Only 88 elements (a 75%) have a place on Earth.
  • 40 of the elements with a place on Earth (a 45%) are located in the United States of America, very far from Greek-Latin cultures, by the way
  • Only 16 of them are located in Europe (a 16%)
  • South-Africa and Philipines have almost all the elements outside of EEUU and Europe.
  • And last but not least, Krypton is in Kentucky, as you can see here:

Bananas02

Clark Kent, Krypton, Kentucky … there are a lot of misteries surrounding Superman … and a lot of K letters!!!!

library(RCurl)
library(XML)
library(ggmap)
library (plotGoogleMaps)
webpage=getURL("http://en.wikipedia.org/wiki/List_of_elements", .opts = opts)
table=readHTMLTable(webpage)[[1]]
table=table[nchar(as.character(table$Element))>2,c("Sym", "Element")]
for (i in 1:nrow(table)) {
 valor=geocode(as.character(table$Element[i]))
 table$lon[i]=valor$lon;table$lat[i]=valor$lat}
table2paint=na.omit(table[, c("lat", "lon", "Sym", "Element")])
coordinates(table2paint)=~lon+lat
proj4string(table2paint)=CRS('+proj=longlat +datum=WGS84')
plotGoogleMaps(table2paint, col="yellow", control.width="0%", control.height="0%", mapTypeId='ROADMAP', legend=FALSE)

What If You Dig A Hole Through The Earth?

It suddenly struck me that that tiny pea, pretty and blue, was the Earth. I put up my thumb and shut one eye, and my thumb blotted out the planet Earth. I didn’t feel like a giant. I felt very, very small (Neil Armstrong)

Where would you come out if you dig a hole straight downward from where you live through the center of the Earth? Supposing you survive to the extremely high pressure and temperature of the nucleus, would you find water or land at the other side? It maybe sound a ridiculous question (I will not refute that) but in this post I will estimate how many people would die drowned and how many will find land in the antipode of where they live. At least, knowledge does not take up any space.

I found a database of the United Nations with very useful information for my experiment: longitude, latitude and population of all capital cities of the world in 2011(1). I assumed that capital cities are a good sample of where people live. Maybe is not the best one since some very big countries are represented by only a city but is a good way to obtain a quick estimation. On the other hand, capital cities represent approximately 7% of the world population so in this sense is a very good sample.

Process is simple: loading the xls file, calculating the antipode of each point and checking where it is. Google provides information about country where a coordinate belongs. For coordinates on the sea, no information is returned. Once you have this, is easy to calculate proportion of people that will find water. My estimation is around 77% of people will find water on the other side. Taking into account that all people leave from land and approximately 70% of the Earth’s surface is water, this figure seems to be small but since both poles are symmetrical and are uninhabited, the estimation makes sense. Here you have a map with the result of the experimet. Points are capital cities and size is related with population. In blue, capitals with antipode on the sea and in brown, capitals with antipode in land:
WorldMapR
By the way, I am one of the 23% of lucky people that would find land in the other side. I live in Madrid, Spain:
madrid
An if some rainy afternoon having little to do I dig a hole through the Earth, I will appear in a place called Weber, in New Zealand:
weber
This estimation can be very silly but the physics involved in the experiment are very interesting as you can see here. By the way, there is a film called Total Recall (2012) where the only way to travel between last two cities in the world is using an elevator through the Earth. Here you have the code:

library(xlsx)
library(ggmap)
library(mapdata)
library(ggplot2)
#The xls file is in http://esa.un.org/unpd/wup/CD-ROM/WUP2011-F13-Capital_Cities.xls
CapitalCities <- read.xlsx("WUP2011-F13-Capital_Cities.xls", sheetName="Capital_Cities", startRow=13,header=TRUE)
names(CapitalCities) = gsub("\\.", "", names(CapitalCities))
#Obtain symmetric coordinates for each capital
CapitalCities$LatitudeSym <- -CapitalCities$Latitude
CapitalCities$LongitudeSym <- -sign(CapitalCities$Longitude)*(180-abs(CapitalCities$Longitude))
CapitalCities$DigResult <- apply(CapitalCities, 1, function(x) {unlist(revgeocode(c(as.numeric(x[11]),as.numeric(x[10]))))})
CapitalCities$Drowned <- is.na(CapitalCities$DigResult)*1
#Percentage of population saved
sum(CapitalCities$Drowned*CapitalCities$Populationthousands)/sum(CapitalCities$Populationthousands)
world <- map_data("world")
opt <- theme(legend.position="none",
axis.ticks=element_blank(),
axis.title=element_blank(),
axis.text =element_blank(),
plot.title = element_text(size = 35),
panel.background = element_rect(fill="turquoise1"))
p <- ggplot()
p <- p + geom_polygon(data=world, aes(x=long, y=lat, group = group),colour="white", fill="lightgoldenrod2" )
p <- p + geom_point(data=CapitalCities, aes(x=Longitude, y=Latitude, color=Drowned, size = Populationthousands)) + scale_size(range = c(2, 20), name="Population (thousands)")
p <- p + labs(title = "What if you dig a hole through the Earth?")
p <- p + scale_colour_gradient(low = "brown", high = "blue")
p <- p + annotate("rect", xmin = -135, xmax = -105, ymin = -70, ymax = -45, fill = "white")
p <- p + annotate("text", label = "Drowned", x = -120, y = -60, size = 6, colour = "blue")
p <- p + annotate("text", label = "Saved", x = -120, y = -50, size = 6, colour = "brown")
p <- p + geom_point(aes(x = -120, y = -65), size=8, colour="blue")
p <- p + geom_point(aes(x = -120, y = -55), size=8, colour = "brown")
p + opt
# Get a map of Spain, centered and signed in Madrid
madrid <- geocode('Madrid, Spain')
map.madrid <- get_map( location = as.numeric(madrid), color = "color", maptype = "roadmap", scale = 2, zoom = 6)
ggmap(map.madrid) + geom_point(aes(x = lon, y = lat), data = madrid, colour = 'red', size = 4)
# Get a map of New Zealand, centered and signed in Weber (the antipode of Madrid)
weber <- geocode('Weber, New Zealand')
map.weber <- get_map( location = as.numeric(weber), color = "color", maptype = "roadmap", scale = 2, zoom = 6)
ggmap(map.weber) + geom_point(aes(x = lon, y = lat), data = weber, colour = 'red', size = 4)

(1) United Nations, Department of Economic and Social Affairs, Population Division (2012). World Urbanization Prospects: The 2011 Revision, CD-ROM Edition.