If you are lost and feel alone, circumnavigate the globe (For You, Coldplay)
You can not consider yourself a R-blogger until you do an analysis of Twitter using twitteR package. Everybody knows it. So here I go.
Inspired by the fabulous work of Jonathan Harris I decided to compare human emotions of people living (or twittering in this case) in different cities. My plan was analysing tweets generated in different locations of USA and UK with one thing in common: all of them must contain the string “I FEEL”. These are the main steps I followed:
- Locate cities I want to analyze using world cities database of
mapspackage - Download tweets around these locations using
searchTwitterfunction oftwitteRpackage. - Cross tweets with positive and negative lists of words and calculate a simple scoring for each tweet as number of positive words – number of negative words
- Calculate how many tweets have non-zero scoring; since these tweets put into words some emotion I call them sentimental tweets
- Represent cities in a bubble chart where x-axis is percentage of sentimental tweets, y-axis is average scoring and size of bubble is population
This is the result of my experiment: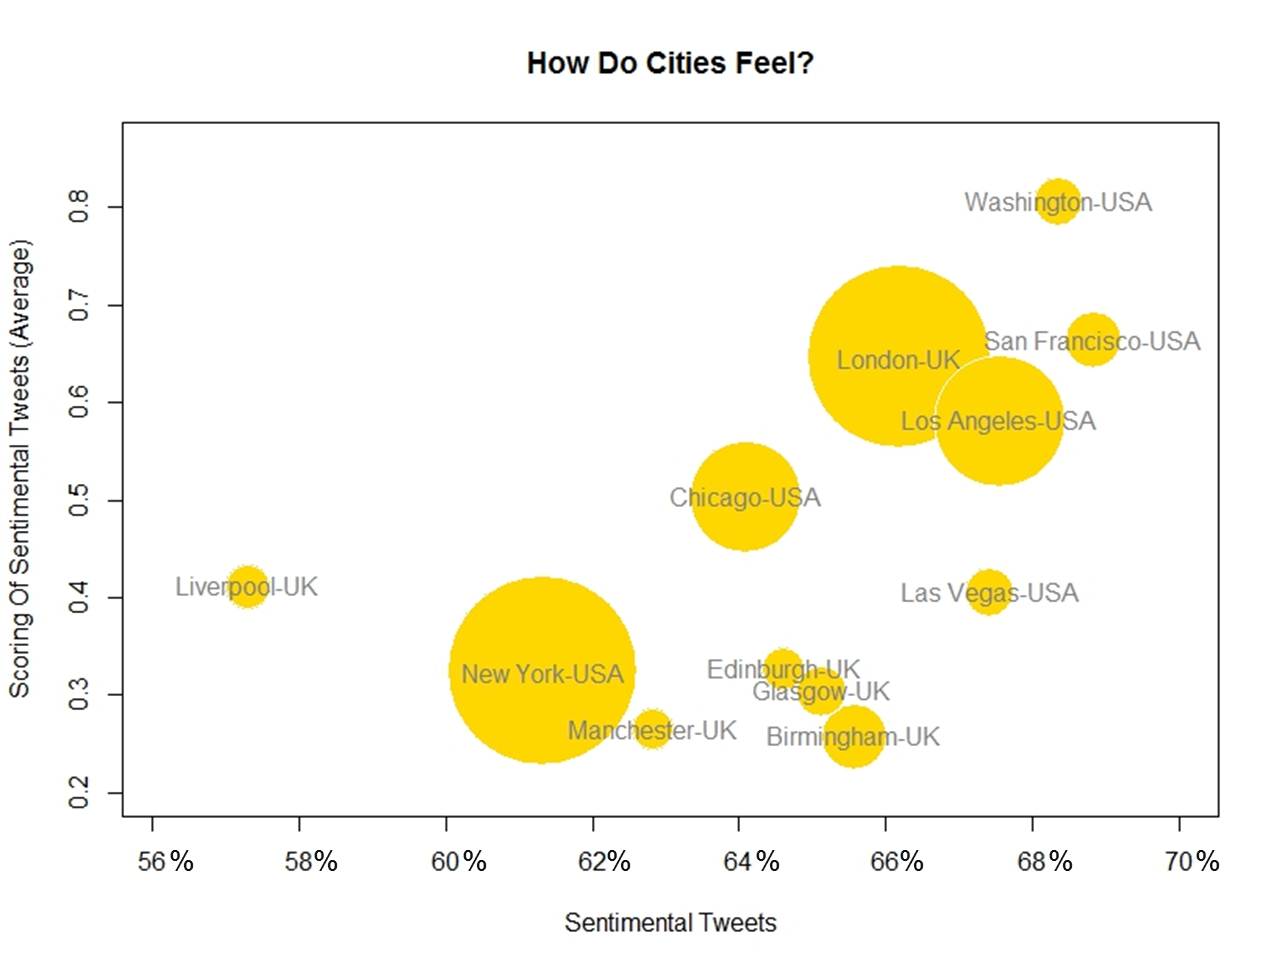
These are my conclusions (please, do not take it seriously):
- USA cities seem to have better vibrations and are more sentimental than UK ones
- Capital city is the happiest one for both countries
- San Francisco (USA) is the most sentimental city of the analysis; on the other hand, Liverpool (UK) is the coldest one
- The more sentimental, the better vibrations
From my point of view, this analysis has some important limitations:
- It strongly depends on particular events (i.e. local football team wins the championship)
- I have no idea of what kind of people is behind tweets
- According to my experience,
searchTwitteronly works well for a small number of searches (no more than 300); for larger number of tweets to return, it use to give malformed JSON response error from server
Anyway, I hope it will serve as starting point of some other analysis in the future. At least, I learned interesting things about R doing it.
Here you have the code:
library(twitteR)
library(RCurl)
library(maps)
library(plyr)
library(stringr)
library(bitops)
library(scales)
#Register
if (!file.exists('cacert.perm'))
{
  download.file(url = 'http://curl.haxx.se/ca/cacert.pem', destfile='cacert.perm')
}
requestURL="https://api.twitter.com/oauth/request_token"
accessURL="https://api.twitter.com/oauth/access_token"
authURL="https://api.twitter.com/oauth/authorize"
consumerKey = "YOUR CONSUMER KEY HERE"
consumerSecret = "YOUR CONSUMER SECRET HERE"
Cred <- OAuthFactory$new(consumerKey=consumerKey,
                         consumerSecret=consumerSecret,
                         requestURL=requestURL,
                         accessURL=accessURL,
                         authURL=authURL)
Cred$handshake(cainfo=system.file("CurlSSL", "cacert.pem", package="RCurl"))
#Save credentials
save(Cred, file="twitter authentification.Rdata")
load("twitter authentification.Rdata")
registerTwitterOAuth(Cred)
options(RCurlOptions = list(cainfo = system.file("CurlSSL", "cacert.pem", package = "RCurl")))
#Cities to analyze
cities=data.frame(
  CITY=c('Edinburgh', 'London', 'Glasgow', 'Birmingham', 'Liverpool', 'Manchester',
         'New York', 'Washington', 'Las Vegas', 'San Francisco', 'Chicago','Los Angeles'),
  COUNTRY=c("UK", "UK", "UK", "UK", "UK", "UK", "USA", "USA", "USA", "USA", "USA", "USA"))
data(world.cities)
cities2=world.cities[which(!is.na(match(
str_trim(paste(world.cities$name, world.cities$country.etc, sep=",")),
str_trim(paste(cities$CITY, cities$COUNTRY, sep=","))
))),]
cities2$SEARCH=paste(cities2$lat, cities2$long, "10mi", sep = ",")
cities2$CITY=cities2$name
#Download tweets
tweets=data.frame()
for (i in 1:nrow(cities2))
{
  tw=searchTwitter("I FEEL", n=400, geocode=cities2[i,]$SEARCH)
  tweets=rbind(merge(cities[i,], twListToDF(tw),all=TRUE), tweets)
}
#Save tweets
write.csv(tweets, file="tweets.csv", row.names=FALSE)
#Import csv file
city.tweets=read.csv("tweets.csv")
#Download lexicon from http://www.cs.uic.edu/~liub/FBS/opinion-lexicon-English.rar
hu.liu.pos = scan('lexicon/positive-words.txt',  what='character', comment.char=';')
hu.liu.neg = scan('lexicon/negative-words.txt',  what='character', comment.char=';')
#Function to clean and score tweets
score.sentiment=function(sentences, pos.words, neg.words, .progress='none')
{
  require(plyr)
  require(stringr)
  scores=laply(sentences, function(sentence, pos.word, neg.words) {
    sentence=gsub('[[:punct:]]','',sentence)
    sentence=gsub('[[:cntrl:]]','',sentence)
    sentence=gsub('\\d+','',sentence)
    sentence=tolower(sentence)
    word.list=str_split(sentence, '\\s+')
    words=unlist(word.list)
    pos.matches=match(words, pos.words)
    neg.matches=match(words, neg.words)
    pos.matches=!is.na(pos.matches)
    neg.matches=!is.na(neg.matches)
    score=sum(pos.matches) - sum(neg.matches)
    return(score)
  }, pos.words, neg.words, .progress=.progress)
  scores.df=data.frame(score=scores, text=sentences)
  return(scores.df)
}
cities.scores=score.sentiment(city.tweets[1:nrow(city.tweets),], hu.liu.pos, hu.liu.neg, .progress='text')
cities.scores$pos2=apply(cities.scores, 1, function(x) regexpr(",",x[2])[1]-1)
cities.scores$CITY=apply(cities.scores, 1, function(x) substr(x[2], 1, x[3]))
cities.scores=merge(x=cities.scores, y=cities, by='CITY')
df1=aggregate(cities.scores["score"], by=cities.scores[c("CITY")], FUN=length)
names(df1)=c("CITY", "TWEETS")
cities.scores2=cities.scores[abs(cities.scores$score)>0,]
df2=aggregate(cities.scores2["score"], by=cities.scores2[c("CITY")], FUN=length)
names(df2)=c("CITY", "TWEETS.SENT")
df3=aggregate(cities.scores2["score"], by=cities.scores2[c("CITY")], FUN=mean)
names(df3)=c("CITY", "TWEETS.SENT.SCORING")
#Data frame with results
df.result=join_all(list(df1,df2,df3,cities2), by = 'CITY', type='full')
#Plot results
radius <- sqrt(df.result$pop/pi)
symbols(100*df.result$TWEETS.SENT/df.result$TWEETS, df.result$TWEETS.SENT.SCORING, circles=radius,
        inches=0.85, fg="white", bg="gold", xlab="Sentimental Tweets", ylab="Scoring Of Sentimental Tweets (Average)",
        main="How Do Cities Feel?")
text(100*df.result$TWEETS.SENT/df.result$TWEETS, df.result$TWEETS.SENT.SCORING, paste(df.result$CITY, df.result$country.etc, sep="-"), cex=1, col="gray50")
Thanks for the great post, truly interesting.
I’m afraid I run into some the re-occuring and sometimes mysterious: “arguments imply differing number of rows” error after runing jeffrey’s sentiment scoring algorithm – cities.scores=score.sentiment(city.tweets[1:nrow(city.tweets),], …
Now here I might say something stupid, please excuse me I only know so much about R.
I can understand differing number of rows being a problem when merging data.frames (rbind, cbind) but not in this case; I have different number of tweets for each city, so what?
Thank you for your comment. Would you like to share your code with me? I will try to help you then. Regards
Thanks for your reply!
I am not sure why but I suspect it has to do with that [1:nrow(city.tweets),].
Anyways, thanks very much for your time, you will find the code below.
> #load libraries
> libs lapply(libs, require, character.only=TRUE)
Loading required package: twitteR
Loading required package: RCurl
Loading required package: bitops
Loading required package: maps
Loading required package: plyr
Attaching package: ‘plyr’
The following object is masked from ‘package:twitteR’:
id
Loading required package: stringr
Loading required package: scales
[[1]]
[1] TRUE
[[2]]
[1] TRUE
[[3]]
[1] TRUE
[[4]]
[1] TRUE
[[5]]
[1] TRUE
[[6]]
[1] TRUE
[[7]]
[1] TRUE
>
> #set working directory
> setwd (“D:/Social Media Analysis/Cities”)
>
> #Register Twitter OAuth
> # I use the updated Twitter package from Github
> #(https://github.com/geoffjentry/twitteR) – Works fine
> setup_twitter_oauth(“API Key”, “API Secret”,
+ “Access Token”,
+ “Access Secret”)
[1] “Using direct authentication”
>
> options(RCurlOptions = list(cainfo = system.file(“CurlSSL”, “cacert.pem”, package = “RCurl”)))
>
> #Cities to analyze
> cities=data.frame(
+ CITY=c(‘Edinburgh’, ‘London’, ‘Glasgow’, ‘Birmingham’, ‘Liverpool’, ‘Manchester’,
+ ‘New York’, ‘Washington’, ‘Las Vegas’, ‘San Francisco’, ‘Chicago’,’Los Angeles’),
+ COUNTRY=c(“UK”, “UK”, “UK”, “UK”, “UK”, “UK”, “USA”, “USA”, “USA”, “USA”, “USA”, “USA”))
> data(world.cities)
> cities2=world.cities[which(!is.na(match(
+ str_trim(paste(world.cities$name, world.cities$country.etc, sep=”,”)),
+ str_trim(paste(cities$CITY, cities$COUNTRY, sep=”,”))
+ ))),]
> cities2$SEARCH=paste(cities2$lat, cities2$long, “10mi”, sep = “,”)
> cities2$CITY=cities2$name
> #Download tweets
> tweets=data.frame()
> for (i in 1:nrow(cities2))
+ {
+ tw=searchTwitter(“I FEEL”, n=400, geocode=cities2[i,]$SEARCH)
+ tweets=rbind(merge(cities[i,], twListToDF(tw),all=TRUE), tweets)
+ }
>
> #Save tweets
> write.csv(tweets, file=”tweets.csv”, row.names=FALSE)
>
> #Import csv file
> city.tweets=read.csv(“tweets.csv”)
>
> #Download lexicon from http://www.cs.uic.edu/~liub/FBS/opinion-lexicon-English.rar
> hu.liu.pos = scan(‘positive-words.txt’, what=’character’, comment.char=’;’)
Read 2006 items
> hu.liu.neg = scan(‘negative-words.txt’, what=’character’, comment.char=’;’)
Read 4783 items
>
> #source sentiment algorithm – (https://github.com/jeffreybreen/twitter-sentiment-
> #analysis-tutorial-201107/tree/master/R)
> source(“Sentiment.R”)
> cities.scores=score.sentiment(city.tweets[1:nrow(city.tweets),], hu.liu.pos, hu.liu.neg, .progress=’text’)
|=======================================================================================| 100%
Error in data.frame(score = scores, text = sentences) :
arguments imply differing number of rows: 18, 4800
Called from: top level
Traceback points to this line in the Sentiment.R file:
scores.df = data.frame(score=scores, text=sentences)
Have you tried to clean the csv file. Sort it and remove blank lines (I found some of them). Maybe it will work then
Hi there, I am new to R. I am getting
Error: Unauthorized
after the following line:
Cred$handshake(cainfo=system.file(“CurlSSL”, “cacert.pem”, package=”RCurl”))
I think this is because of:
consumerKey = “YOUR CONSUMER KEY HERE”
consumerSecret = “YOUR CONSUMER SECRET HERE”
May I ask what does consumerKey and ConsumerSecret referring to?
You have to register API getting your own credentials from Twitter developers site. Check this document, it explains process very well
http://decisionstats.com/2014/02/26/using-r-with-twitter-great-tutorial-in-rstats/
Keep in touch. regards,
Antonio
Thanks Antonio, that works… Thanks my friend…
I managed to fix it with some horrendous code of mine, thanks for your help 🙂
i am also having the same error as yours. can you please help me fix it.. thanks
Hello, can you please guide me how did you manage to sort out the error because I am also facing the same one.
i got the same error what to do?
cities.scores=score.sentiment(city.tweets$text, hu.liu.pos, hu.liu.neg, .progress=’text’) – does this help?
I keep running into the rate limit. How did you get around that? Here is the warning message:
“In doRppAPICall(“search/tweets”, n, params = params, retryOnRateLimit = retryOnRateLimit, :
400 tweets were requested but the API can only return 399″
I had the same problem when I did it so I stored tweets during a few days to accumulate enough information to do my experiment.