Remember me, remember me, but ah! forget my fate (Dido’s Lament, Henry Purcell)
A Voronoi diagram divides a plane based on a set of original points. Each polygon, or Voronoi cell, contains an original point and all that are closer to that point than any other.
This is a nice example of a Voronoi tesselation. You can find good explanations of Voronoi diagrams and Delaunay triangulations here (in English) or here (in Spanish).
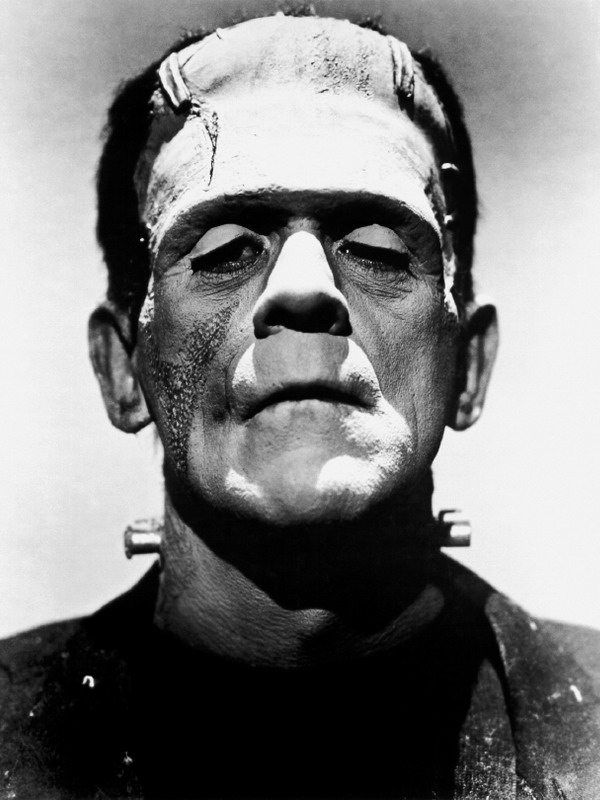
A grayscale image is simply a matrix where darkness of pixel located in coordinates (i, j) is represented by the value of its corresponding element of the matrix: a grayscale image is a dataset. This is a Voronoi diagraman of Frankenstein:

To do it I followed the next steps:
- Read this image
- Convert it to gray scale
- Turn it into a pure black and white image
- Obtain a random sample of black pixels (previous image corresponds to a sample of 6.000 points)
- Computes the Voronoi tesselation
Steps 1 to 3 were done with imager, a very appealing package to proccess and analice images. Step 5 was done with deldir, also a convenient package which computes Delaunay triangulation and the Dirichlet or Voronoi tessellations.
The next grid shows tesselations for sample size from 500 to 12.000 points and step equal to 500:


I gathered all previous images in this gif created with magick, another amazing package of R I discovered recently:

This is the code:
library(imager)
library(dplyr)
library(deldir)
library(ggplot2)
library(scales)

# Download the image
file="http://ereaderbackgrounds.com/movies/bw/Frankenstein.jpg"
download.file(file, destfile = "frankenstein.jpg", mode = 'wb')

# Read and convert to grayscale
load.image("frankenstein.jpg") %>% grayscale() -> x

# This is just to define frame limits
x %>%
  as.data.frame() %>%
  group_by() %>%
  summarize(xmin=min(x), xmax=max(x), ymin=min(y), ymax=max(y)) %>%
  as.vector()->rw

# Filter image to convert it to bw
x %>%
  threshold("45%") %>%
  as.cimg() %>%
  as.data.frame() -> df

# Function to compute and plot Voronoi tesselation depending on sample size
doPlot = function(n)
{
  #Voronoi tesselation
  df %>%
  sample_n(n, weight=(1-value)) %>%
  select(x,y) %>%
  deldir(rw=rw, sort=TRUE) %>%
  .$dirsgs -> data

  # This is just to add some alpha to lines depending on its longitude
  data %>%
    mutate(long=sqrt((x1-x2)^2+(y1-y2)^2),
         alpha=findInterval(long, quantile(long, probs = seq(0, 1, length.out = 20)))/21)-> data

  # A little bit of ggplot to plot results
  data %>%
    ggplot(aes(alpha=(1-alpha))) +
    geom_segment(aes(x = x1, y = y1, xend = x2, yend = y2), color="black", lwd=1) +
    scale_x_continuous(expand=c(0,0))+
    scale_y_continuous(expand=c(0,0), trans=reverse_trans())+
    theme(legend.position  = "none",
            panel.background = element_rect(fill="white"),
            axis.ticks       = element_blank(),
            panel.grid       = element_blank(),
            axis.title       = element_blank(),
            axis.text        = element_blank())->plot

return(plot)
}

# I call the previous function and store resulting plot in jpeg format
i=5000
name=paste0("frankie",i,".jpeg")
jpeg(name, width = 600, height = 800, units = "px", quality = 100)
doPlot(i)
dev.off()

# Once all images are stored I can create gif
library(magick)
frames=c()
images=list.files(pattern="jpeg")

for (i in length(images):1)
{
  x=image_read(images[i])
  x=image_scale(x, "300")
  c(x, frames) -> frames
}
animation=image_animate(frames, fps = 2)
image_write(animation, "Frankenstein.gif")
Really nice! Do you have any advice to give on the properties of the input picture?
I have just tried to adjust this to the “divine touch” (https://en.wikipedia.org/wiki/File:Hands_of_God_and_Adam.jpg) but had little luck.
Thanks. The key is using images with high contrast. I think your image can work. Play with threshold. Good luck!
Fun post, thanks for taking the time to write and share it!
One note though: unless I’m mistaken, I think you forgot a for loop in your published code for the lines 58-62.
Thanks, I did it one by one because using a loop images were not rendered properly.
Wonderful post.
I guess you could get some sort of ‘average’ or transformed colour for each polygon using the original image.
Thanks! Would be nice! I will try to in the future. Cheers!
What an unfortunate name for a package (deldir). First thing I thought when I saw that was “why a tool to remove an entire directory from my hard drive?” 🙂
Yes! I think name comes from Delaunay and Dirichlet triangulation
My next thought was: does anyone know of a 3-dimensional delaunay/voroni calculator?
Answering my own question: most 3d rendering tools such as meshmixer (autodesk) will do this for you.
this is why I love R and the people using it. Thanks!
Cool!
Very cool and insightful analysis!
I have one question, though: after copying and pasting the code provided in this article, I received an error, because R could not find the ‘value’ object from the doPlot() function that you wrote.
I read your example a couple of times, but the contents of the value object are not specified. Using value = seq(0, 1, length.out = nrow(df)) inside the doPlot() function, I could at least recreate the analysis, but it resulted in an image that looks inverted (compared to your result).
So, what values do you use for the value object?
Thanks in advance!
Can you send me exactly the code you are running? You can find my email in the about section of fronkonstin
Yes! I sent you an e-mail this afternoon. Thanks in advance!
Ok. Received. I will answer asap. Thanks
What is the answer to this question? I am also trying to reproduce the example above, but cannot seem to get the right value for `value`. Thank you!
Fixed! Code updated. Thanks.
Beautiful, I will try some experiments with it, it reminds me a lot of the stuff you can do in processing 🙂
Yes! I used Processing as well (long time ago). Thanks!
When running your code in R-Studio, I get the following error when running doPlot() “Error in overscope_eval_next(overscope, expr) : object ‘value’ not found”
any ideas how to fix this?
Copying the traceback:
12.
overscope_eval_next(overscope, expr)
11.
eval_tidy(enquo(weight), tbl)
10.
sample_n.data.frame(., n, weight = (1 – value))
9.
sample_n(., n, weight = (1 – value))
8.
function_list[[i]](value)
7.
freduce(value, `_function_list`)
6.
`_fseq`(`_lhs`)
5.
eval(expr, envir, enclos)
4.
eval(quote(`_fseq`(`_lhs`)), env, env)
3.
withVisible(eval(quote(`_fseq`(`_lhs`)), env, env))
2.
df %>% sample_n(n, weight = (1 – value)) %>% select(x, y) %>%
deldir(rw = rw, sort = TRUE) %>% .$dirsgs
1.
doPlot(i)
nevermind, i didn’t noticed you changed the code
Thanks a lot for sharing this. It inspired me to make a music video that uses Voronoi tesselation for the “spider web” effect (implemented in Python and not R, though 😉 You can have a look at it here: https://mkonrad.net/2018/07/29/a-synthesized-music-video-with-moviepy.html
I LOVE it! I also love your music. I play in a band as well and I know how difficult is to make music. You are really great 🙂 Thanks
Thanks for sharing this. What should I change to use the Delaunay triangulation instead of the Voronoi tesselation?
Use .$delsgs instead .$dirsgs
Thanks