Nothing in Nature is random … A thing appears random only through the incompleteness of our knowledge (Benedict Spinoza)
This is one of my favorite mathematical mysteries. In 1991 David Boll was trying to confirm that the neck of the Mandelbrot Set is 0 in thickness. Neck is located at -0.75+0i (where two biggest circles meet each other). 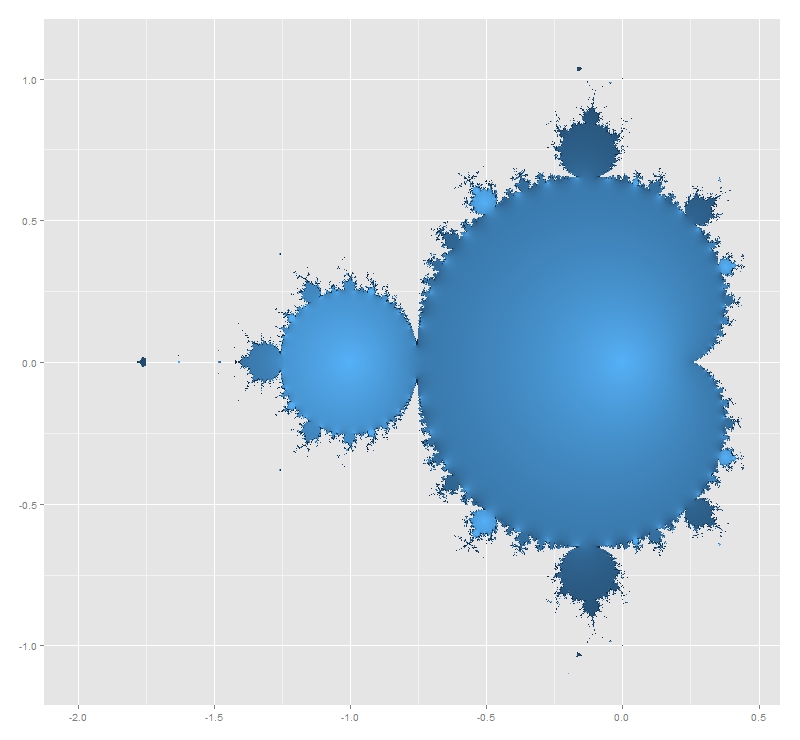 He tried with complex numbers like -0.75+εi for small values of ε demonstrating the divergence of all these numbers. And here comes the mystery: multiplying ε and the corresponding number of iterations it took for the iterate to diverge, gives an approximation of π that is within ±ε. Is not fascinating? I replicated David Boll’s experiment for positive and negative values of ε. I draw results as follows:
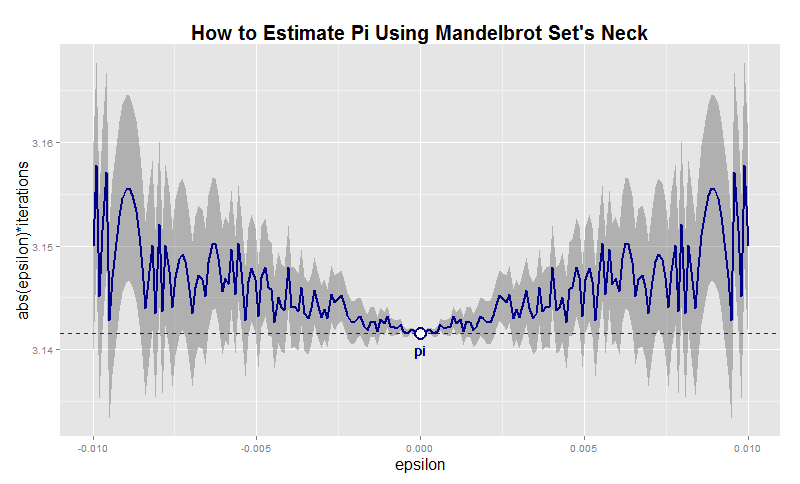
Before doing it, I thought I was going to find some pattern in the graphic. Apart from the mirror effect produced by the sign of ε, there is nothing recognizable. Convergence is chaotic. Here you have the code. This example is also nice to practice with ggplot2 package, one of the totems of R:
i<-0    # Counter of iterations
x  <- 0 # Initialization
while (Mod(x) <= 2)
{
x <- x^2+(c+complex(real = 0, imaginary = e))
i <- i+1
}
i
}
results <- as.data.frame(c(NULL,NULL))
for (j in 1:length(epsilons))
{results <- rbind(results, c(epsilons[j], testMSConvergence(epsilons[j])))}
colnames(results) <- c('epsilon', 'iterations')
dev.off()
p <- ggplot(results, aes(epsilon,abs(epsilon)*iterations))+
xlab("epsilon")+
ylab("abs(epsilon)*iterations")+
opts(axis.title.x=theme_text(size=16)) +
opts(axis.title.y=theme_text(size=16)) +
ggtitle("How to Estimate Pi Using Mandelbrot Set's Neck")+
theme(plot.title = element_text(size=20, face="bold"))
p <- p + geom_ribbon(data=results,aes(ymin=abs(epsilon)*iterations-abs(epsilon),ymax=abs(epsilon)*iterations+abs(epsilon)), alpha=0.3)
p <- p + geom_abline(intercept = pi, , slope = 0, size = 0.4, linetype=2, colour = "black", alpha=0.8)
p <- p + geom_line(colour = "dark blue", size = 1, linetype = 1)
p <- p + geom_text(x = 0, y = pi, label="pi", vjust=2, colour="dark blue")
p <- p + geom_point(x = 0, y = pi, size = 6, colour="dark blue")
p + geom_point(x = 0, y = pi, size = 4, colour="white")
Interesting! The convergence may be chaotic, but the Symmetry of that ” minor effect” is quite appealing and obvious.