317 is a prime, not because we think so, or because our minds are shaped in one way rather than another, but because it is so, because mathematical reality is built that way (G.H. Hardy)
In 1958, the mathematician and magician Norman L. Gilbreath presented a disconcerting hypothesis conceived in the back of a napkin. Gilbreath wrote first prime numbers in a row. In the next rows, he wrote the difference in absolute value of consecutive values of previous row. Beginning with first 20 primes in the first row, he obtained something like this: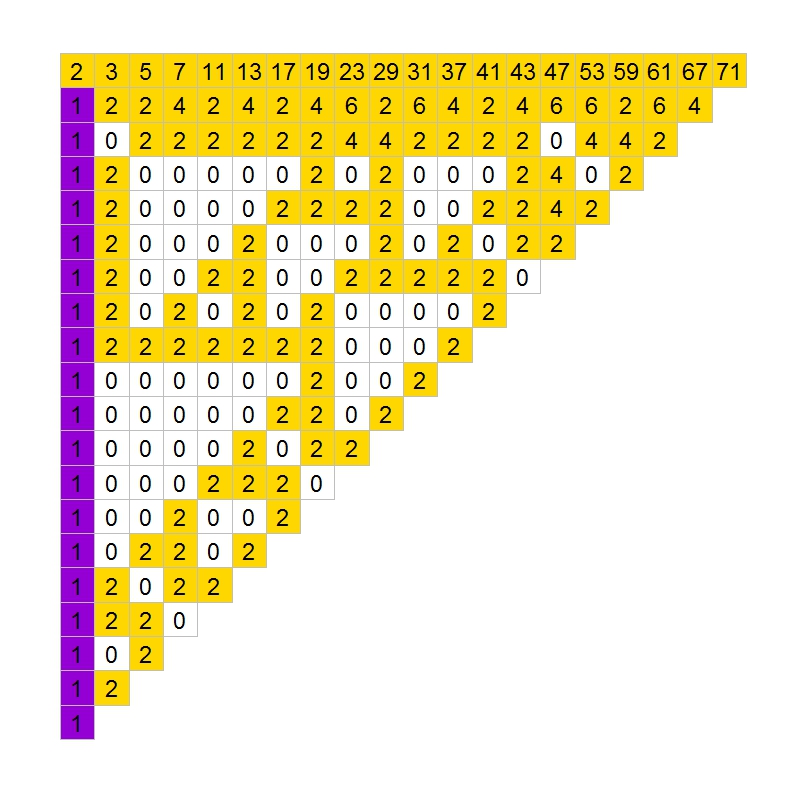
The conjecture is easy: except for the first one, all elements of the first column are 1. So far, no one has demonstrated this hypothesis. In fact, according to mathematician Richard Guy, it seems unlikely that we will see a demonstration of Gilbreath’s conjecture in the near future, though probably this conjecture is true.
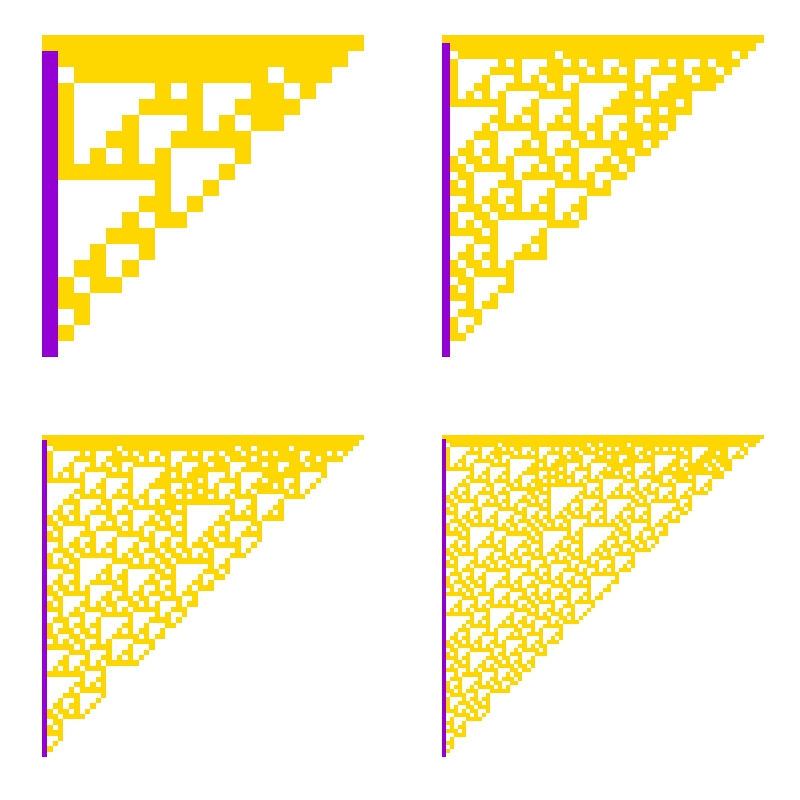
In the previous chart, I coloured zeros in white, ones in violet and rest of numbers in gold. The conjecture says that except for the first element, the first column is entirely violet. Following you can see the coloured chart for first 20, 40, 60 and 80 prime numbers:
It is nice how zeros create triangular patterns similar to patterns created by cellular automata. This is the chart for first 200 primes: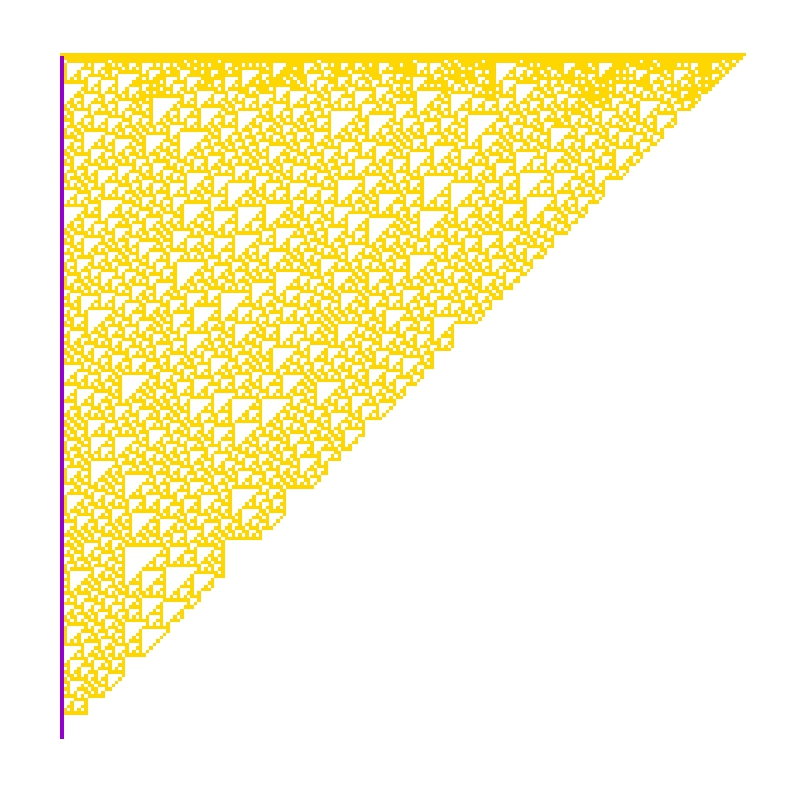
How much time will it take to demonstrate this simple conjecture? Who knows. Meanwhile, you can draw triangles with this code:
library(ggplot2)
create.gilbreath=function(n)
{
require(reshape)
require(schoolmath)
data(primlist)
gilbreath=t(matrix(primlist[2:(n+1)], n, n))
for (i in 2:n) {gilbreath[i,]=c(eval(parse(text=paste(c(paste("abs(diff(",collapse=""), "gilbreath[i-1,]", paste("))",collapse="")),collapse=""))),rep(NA,1))}
na.omit(melt(t(gilbreath)))
}
opt=theme(legend.position="none",
panel.background = element_blank(),
panel.grid = element_blank(),
axis.ticks=element_blank(),
axis.title=element_blank(),
axis.text =element_blank())
gilbreath=create.gilbreath(20)
gilbreath$value1=cut(gilbreath$value, breaks=c(-Inf,1:2,Inf), right = FALSE)
ggplot(gilbreath, aes(x=X1, y=X2)) +
geom_tile(aes(fill = value1), colour="grey") +
scale_fill_manual(values = c("white", "darkviolet", "gold"))+
geom_text(label=gilbreath$value, size=8)+
scale_y_reverse()+opt