Anyone who considers arithmetical methods of producing random digits is, of course, in a state of sin (John von Newman)
Ms. Positive and Mr. Negative live in a one-dimensional world and are falling in love. But beginnings are not always easy. They have a big problem: none of them like the other’s neighborhood. Ms. Positive only wants to walk around Positive Integer Numbers Neighborhood and Mr. Negative around Negative Integers Numbers one. This is a prickly problem they need to deal with as soon as possible. But they have a good idea. They will start their walks from Zero, an impartial place between both neighborhoods and will let fate to guide their feet. They will toss a coin to decide every step: if result is head, they will advance 1 step toward positive numbers neighborhood; if tail, they will advance 1 step toward negative numbers one. For example, if the first 5 tosses are face, face, tail, tail and tail, the their first 5 steps will be +1, +2, +1, 0 and -1. It seems to be a fair agreement for both. Maybe is not the most pleasant way to take a walk but It is well known that lovers use to do silly things constantly, especially at the beginnings. They always walk for two hours, so they toss the coin 7.200 times every walk (these lovers are absolutely crazy as you can see). This was their first walk:

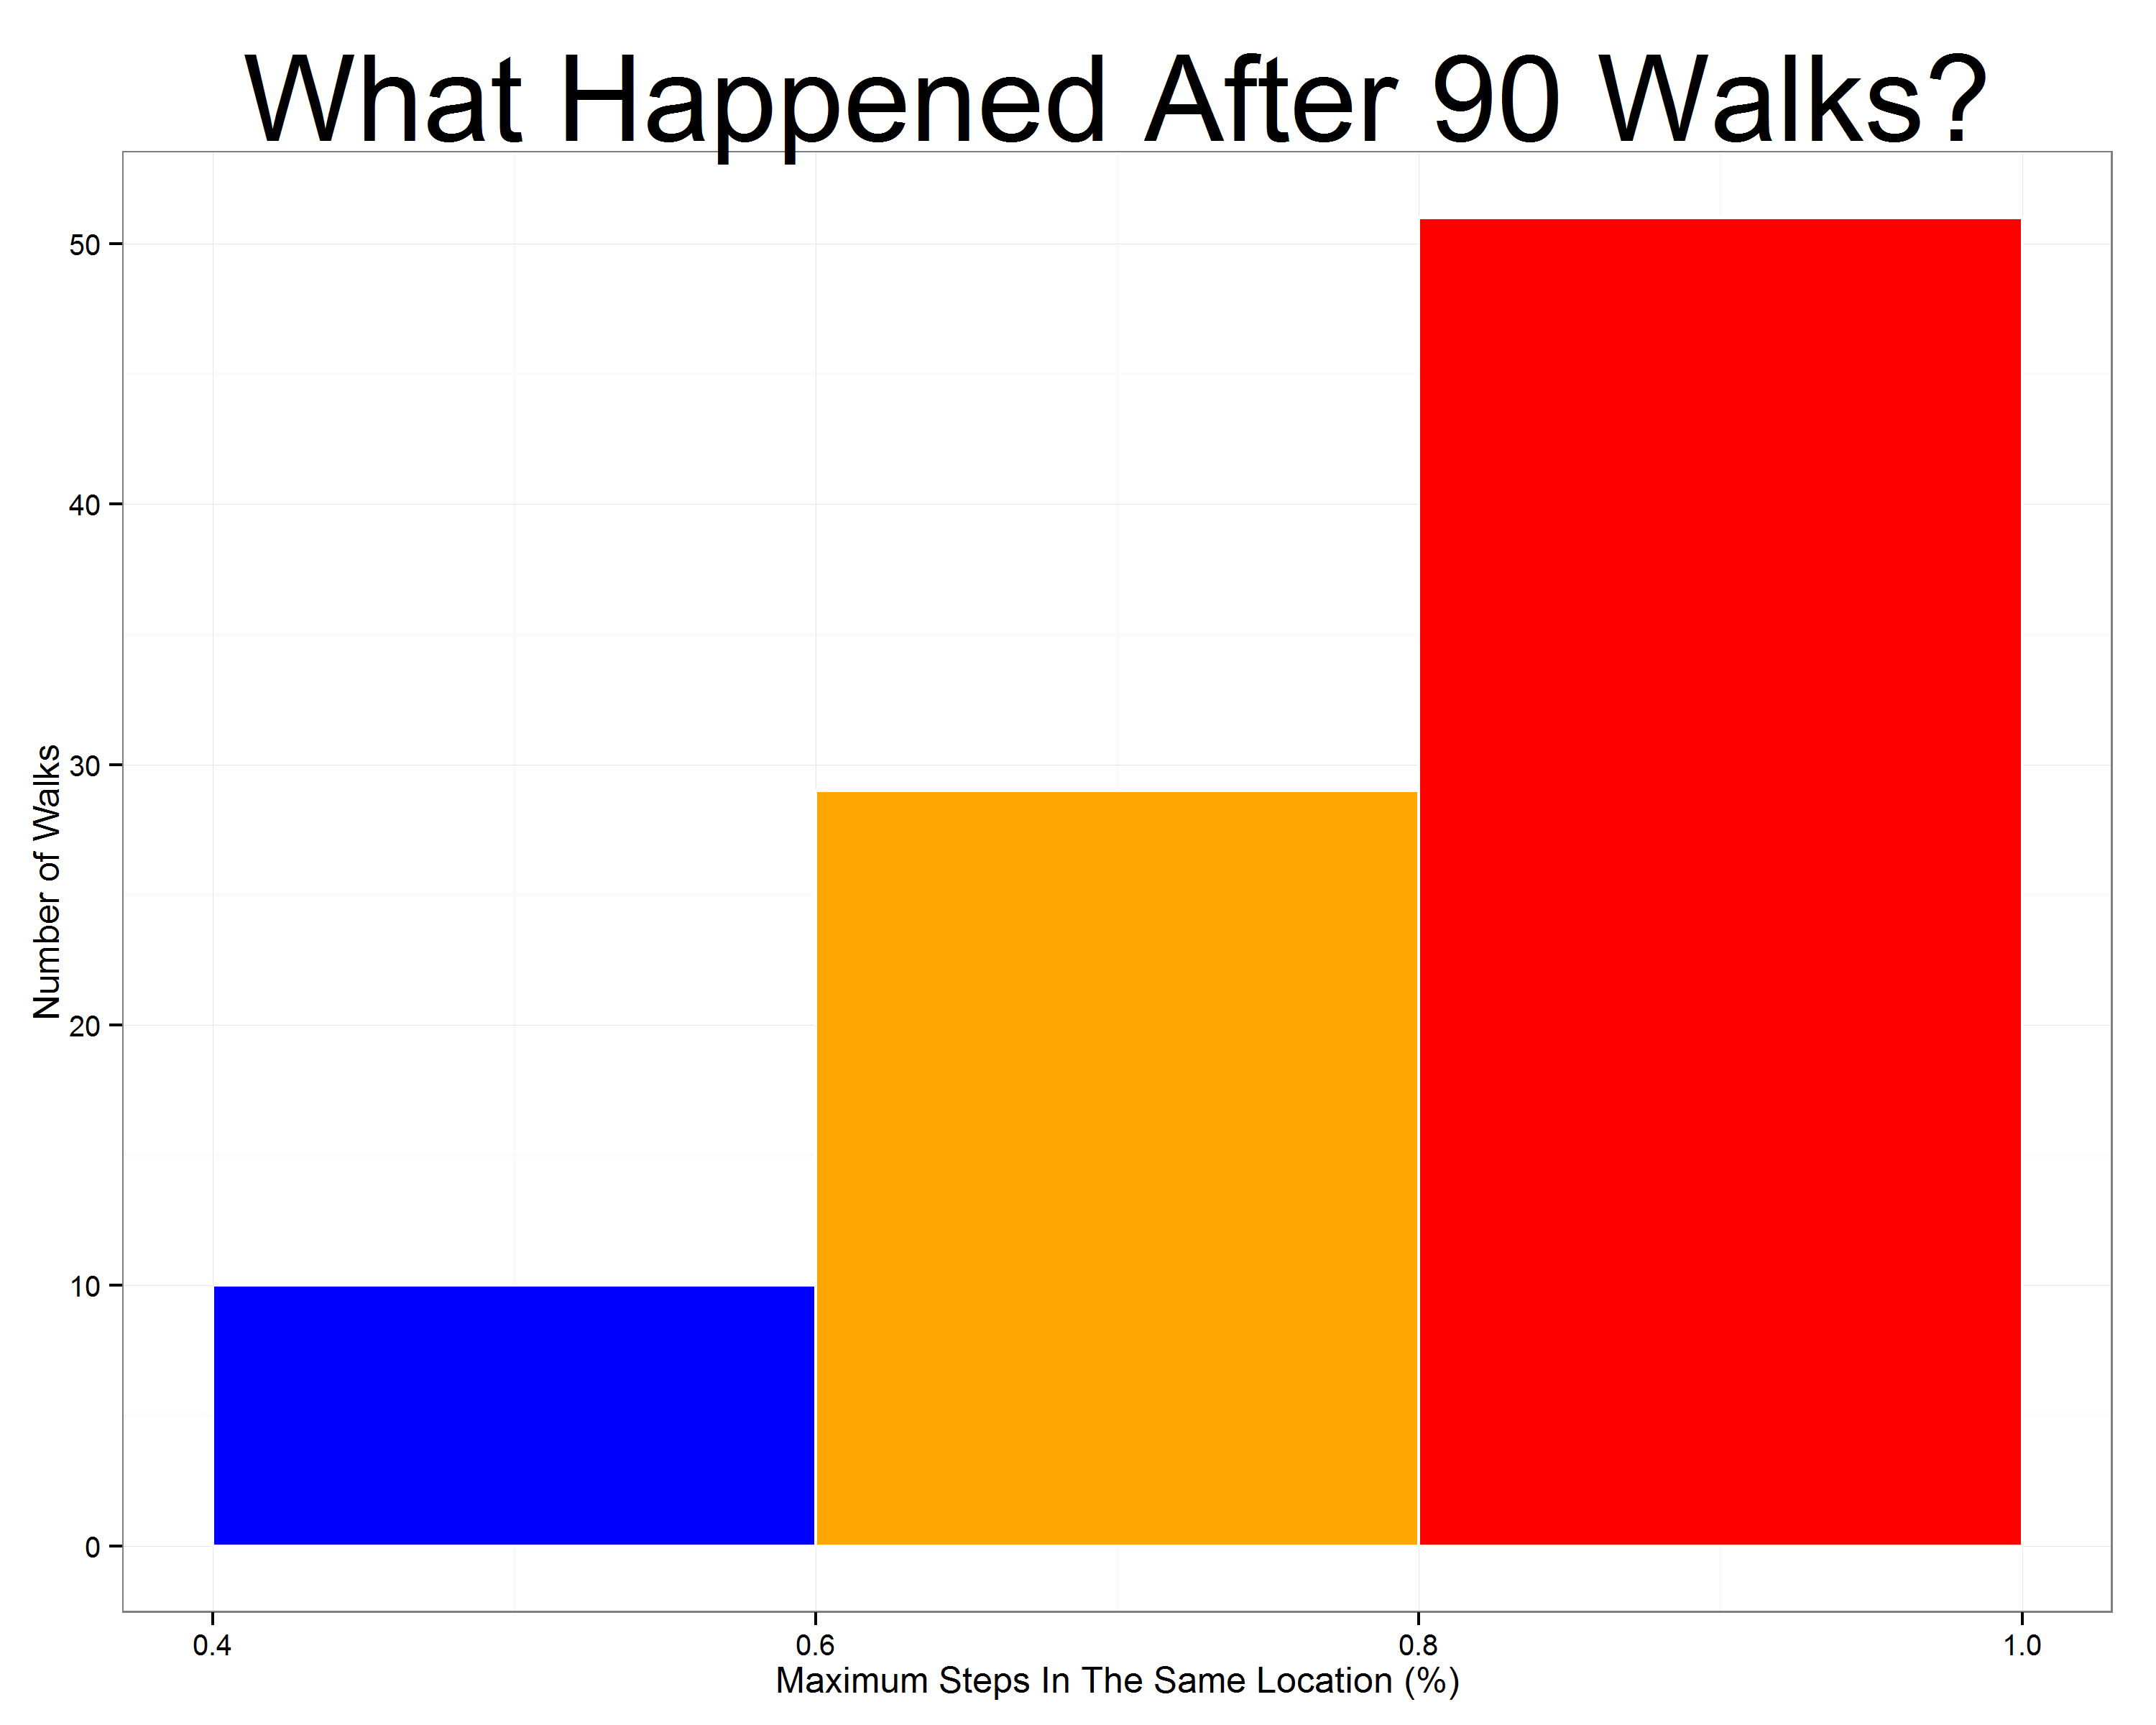
After this first walk, Mr Negative was really upset. Ms. Positive, watching his face fell, ask him: What’s the matter, honey? and Mr. Negative replied: What’s the matter? What’s the matter? The matter is that we spent almost all the time walking around your horrible neighborhood! What comes next is too hard to be reproduced here. Anyway, they agreed to give a chance to the method they designed. How can one imagine that a coin can produce such a strange walk! There must be an error! After 90 walks, the situation of our lovers was extremely delicate. A 57% of the walks were absolutely awful for one of them since more than 80% of the steps were around the same neighborhood. Another 32% were a bit uncomfortable for one of them since between 60% and 80% of the steps were around the same neighborhood. Only 11% of the walks were gratifying. How is it possible?, said Mr. Negative. How is it possible?, said Ms. Positive.
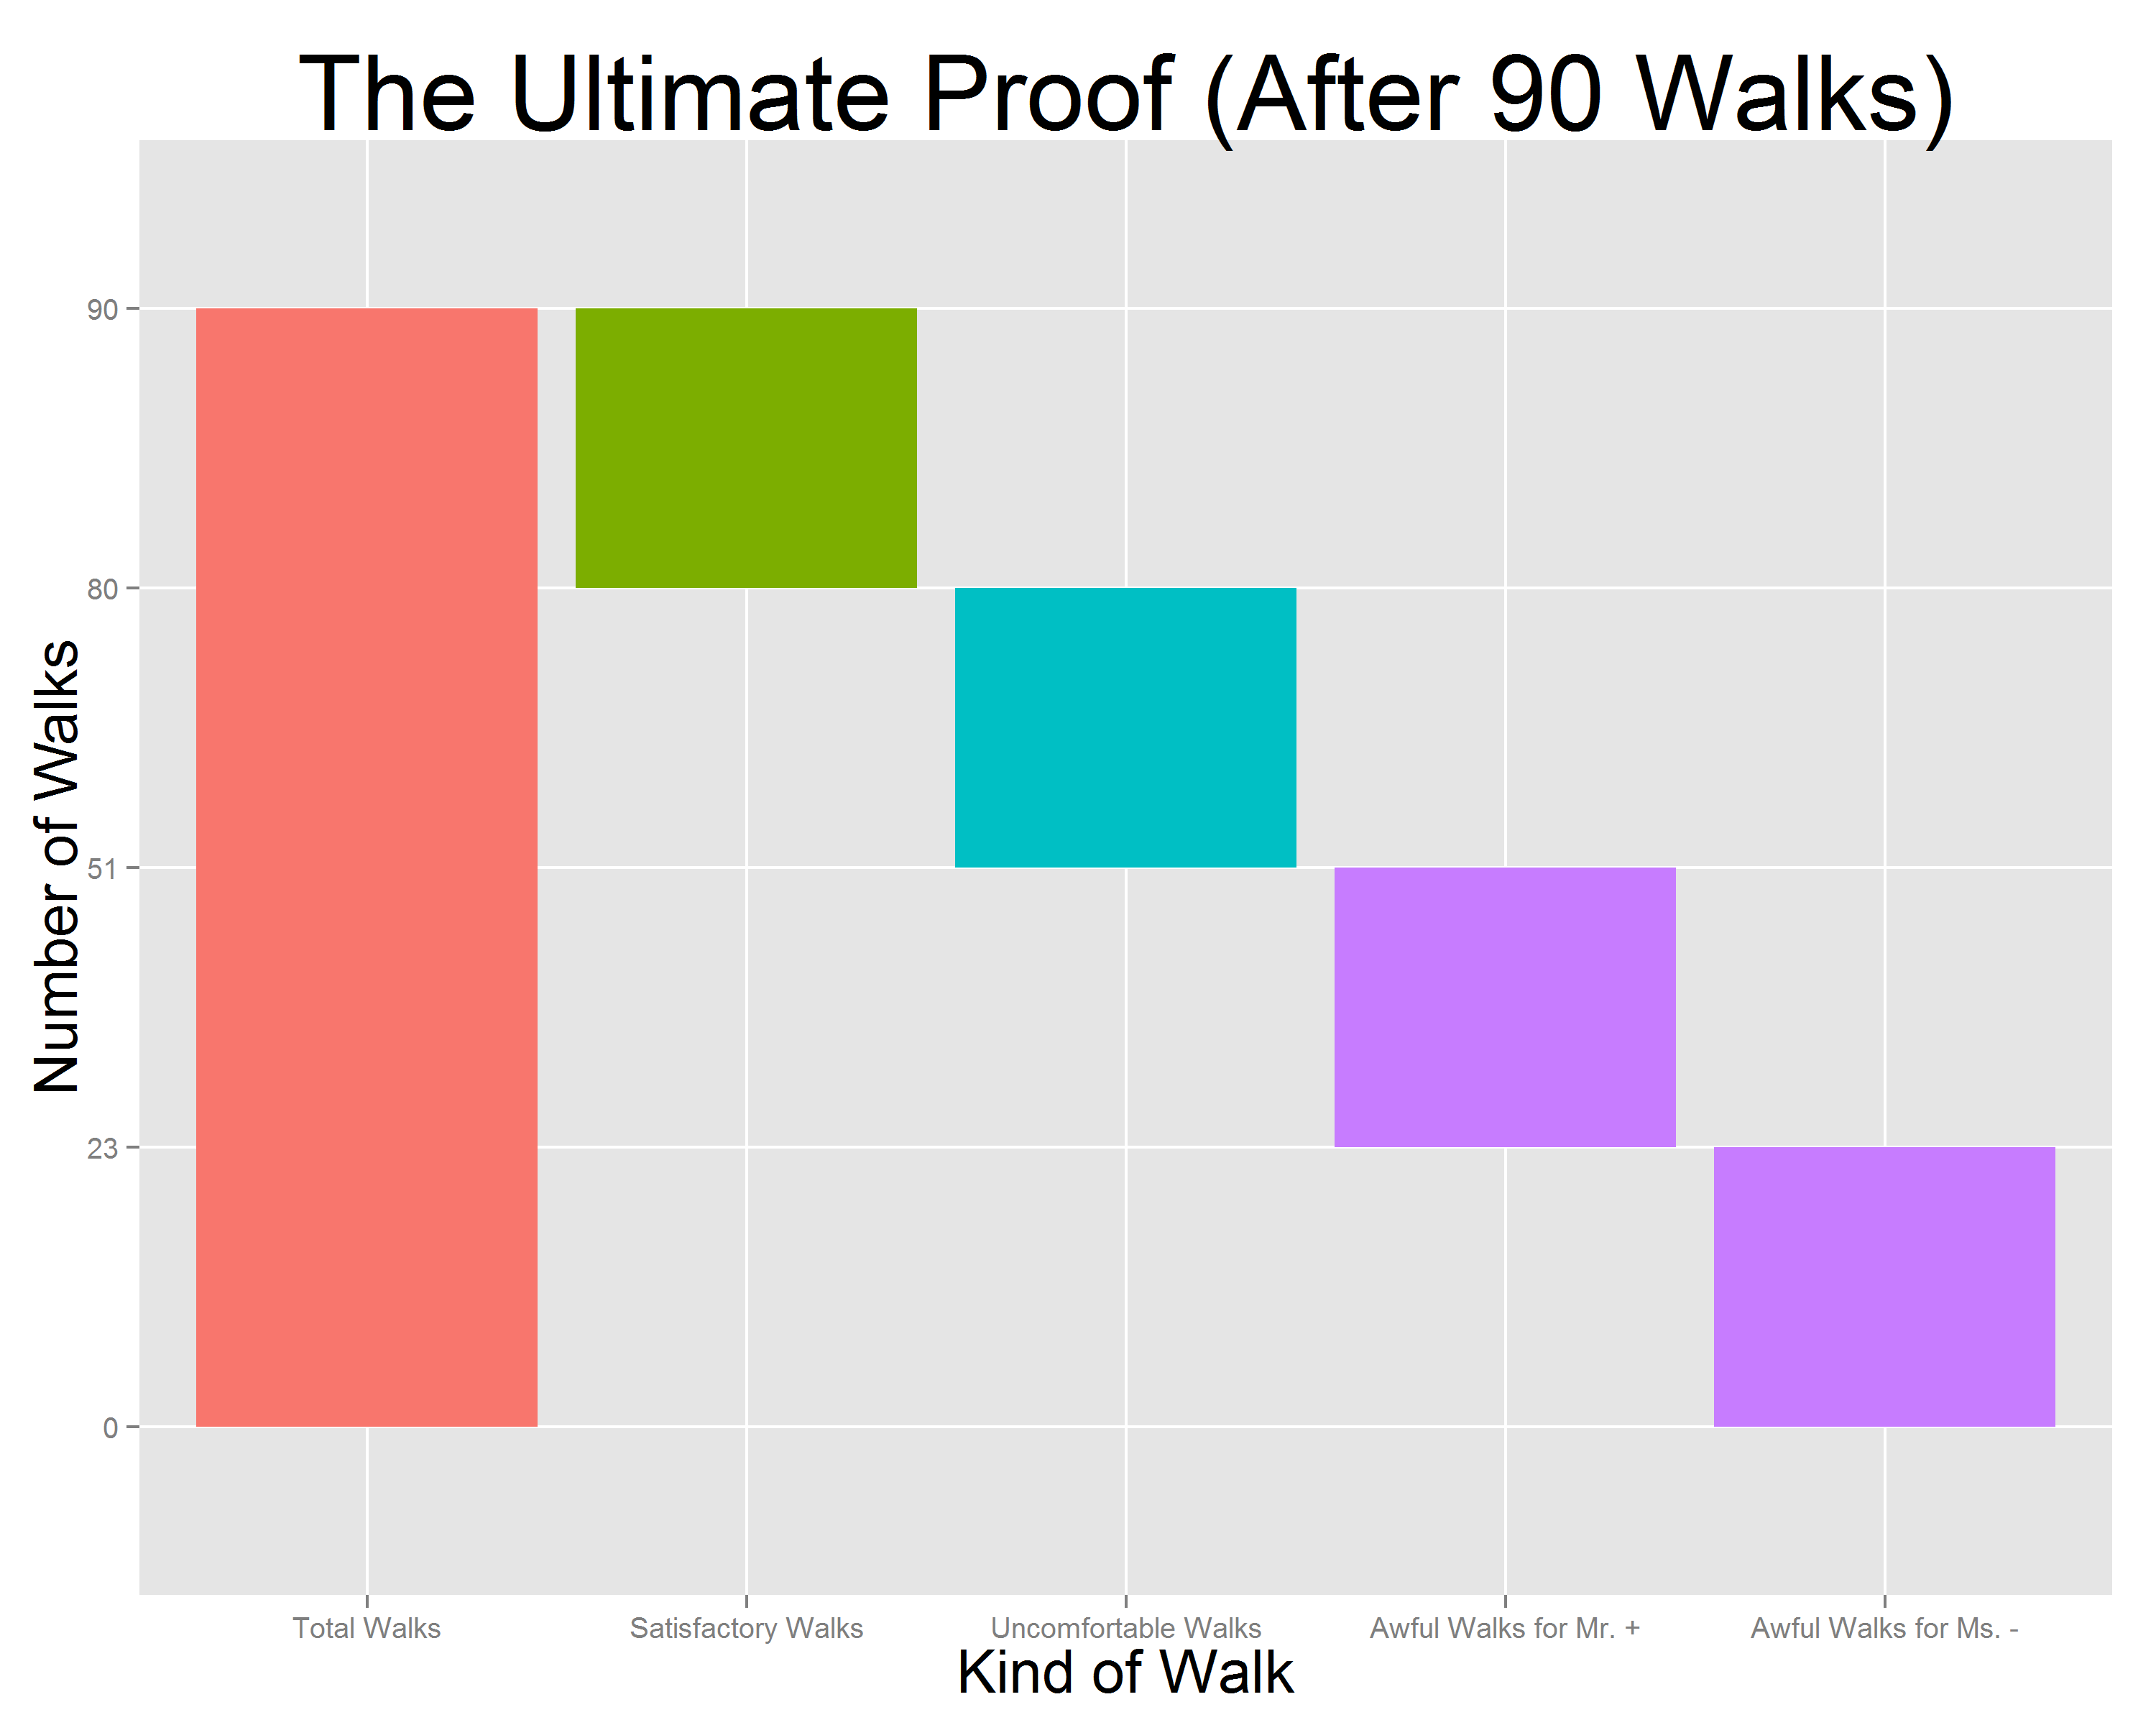
But here comes Ms. Positive, who always looks on the brigth side of life: Don’t worry, darling. In fact, we don’t have to be sad. We get angry the same amount of times! For me is enough. What about you?, said her. For me is perfect as well!, said Mr. Negative. In that moment, they realise they were made for each other and started another random walk with a big smile on their faces.
This is the code:
library(ggplot2)
steps   <- 2*60*60 #Number of steps
results <- data.frame()
walks<-90 #Number of walks
for (i in 1:walks)
{
  state <- cumsum(sample(c(-1,1), steps, replace = TRUE))
  results <- rbind(results, c(sum(state<0), sum(state>0), sum(state==0),
                              if (sum(state<0) >= sum(state>0)) 1 else 0))
}
colnames(results) <- c("neg.steps", "pos.steps", "zero.steps", "ind.neg")
results$max.steps <- apply(results, 1, max)/apply(results, 1, sum)
#Plot of one of these walks
mfar=max(abs(max(state)),abs(min(state)))
plot1 <- qplot(seq_along(state),
      state,
      geom="path")+
  xlab("Step") +
  ylab("Location") +
  labs(title = "The First Walk Of Ms. Positive And Mr. Negative")+
  theme(plot.title = element_text(size = 35))+
  theme(axis.title.y = element_text(size = 20))+
  theme(axis.title.x = element_text(size = 20))+
  scale_x_continuous(limits=c(0, length(state)),breaks=c(1,steps/4,steps/2,3*steps/4,steps))+
  scale_y_continuous(limits=c(-mfar, mfar), breaks=c(-mfar,-mfar/2, 0, mfar/2,mfar))+
  geom_hline(yintercept=0)
ggsave(plot1, file="plot1.png", width = 12, height = 10)
#Summary of all walks
hist1 <- ggplot(results, aes(x = max.steps))+
  geom_histogram(colour = "white",breaks=seq(.4,1,by=.2),fill=c("blue", "orange", "red"))+
  theme_bw()+
  labs(title = paste("What Happened After ", toString(walks), " Walks?",sep = ""))+
  scale_y_continuous(breaks=seq(0,(nrow(results[results$max.steps>.8,])+10),by=10))+
  theme(plot.title = element_text(size = 40))+
  xlab("Maximum Steps In The Same Location (%)") +
  ylab("Number of Walks")
ggsave(hist1, file="hist1.png", width = 10, height = 8)
#Data for waterfall chart
waterfall <- as.data.frame(cbind(
  c("Total Walks", "Satisfactory Walks", "Uncomfortable Walks", "Awful Walks for Mr. +", "Awful Walks for Ms. -"),
  c("a", "b", "c", "d", "d"),
  c(0,
    nrow(results),
    nrow(results)-nrow(results[results$max.steps<.6,]),
    nrow(results)-nrow(results[results$max.steps<.6,])-nrow(results[results$max.steps>=.6 & results$max.steps<.8,]),
    nrow(results)-nrow(results[results$max.steps<.6,])-nrow(results[results$max.steps>=.6 & results$max.steps<.8,])-nrow(results[results$max.steps>=.8 & results$ind.neg==1,])
    ),
  c(nrow(results),
    nrow(results)-nrow(results[results$max.steps<.6,]),
    nrow(results)-nrow(results[results$max.steps<.6,])-nrow(results[results$max.steps>=.6 & results$max.steps<.8,]),
    nrow(results)-nrow(results[results$max.steps<.6,])-nrow(results[results$max.steps>=.6 & results$max.steps<.8,])-nrow(results[results$max.steps>=.8 & results$ind.neg==1,]),
    0
    ),
  c(nrow(results),
    nrow(results[results$max.steps<.6,]),
    nrow(results[results$max.steps>=.6 & results$max.steps<.8,]),
    nrow(results[results$max.steps>=.8 & results$ind.neg==1,]),
    nrow(results[results$max.steps>=.8 & results$ind.neg==0,]))
))
colnames(waterfall) <-c("desc", "type", "start", "end", "amount")
waterfall$id <- seq_along(waterfall$amount)
waterfall$desc <- factor(waterfall$desc, levels = waterfall$desc)
#Waterfall chart
water1 <- ggplot(waterfall, aes(desc, fill = type)) +
  geom_rect(aes(x = desc, xmin = id-0.45, xmax = id+0.45, ymin = end, ymax = start))+
  xlab("Kind of Walk") +
  ylab("Number of Walks") +
  labs(title = "The Ultimate Proof (After 90 Walks)")+
  theme(plot.title = element_text(size = 35))+
  theme(axis.title.y = element_text(size = 20))+
  theme(axis.title.x = element_text(size = 20))+
  theme(legend.position = "none")
Hi. I don’t get this phenomenon. Is there a name to it? Could you please explain a bit further? It seems quite important.
Thank you!
Wolfran Alpha explains better than me: http://mathworld.wolfram.com/RandomWalk1-Dimensional.html
William Feller, an important mathematician expert in theory of probability has a book called “An Introduction to Probability Theory and Its Applications” where there is a chapter about fluctuations in coin tossing and random walks. You can find there a very nice explanation of this phenomena, which is very “anti common sense” from my opinion. Thanks!
Definitely very anti-common sense! That’s what makes it interesting. Thanks for posting this phenomenon. Will investigate it further. Wonder what kind of implications it has on finance…
This phenomenon and the distribution you have found is called the arc-sin law of Random Walks. It is based on the fact that the the first return time of a random walk to zero is oftenly large. In fact its expected value is infinite.
I have a blog post about this phenomenon and the (not-so-simple) mathematics behind it:
http://estebanmoro.org/2009/04/the-probability-of-going-through-a-bad-patch/
Thanks a lot for your comment, Esteban. I will follow you blog henceforth. Regards and Happy 2015.