Tag Archives: sqldf

PageRank For SQL Lovers

If you’re changing the world, you’re working on important things. You’re excited to get up in the morning (Larry Page, CEO and Co-Founder of Google)

This is my particular tribute to one of the most important, influential and life-changer R packages I have discovered in the last times: sqldf package.

Because of my job, transforming data through SQL queries is very natural for me. This, together with the power of R made this package indispensable for me since I knew of its existence.

Imagine you have a directed graph like this:PR1

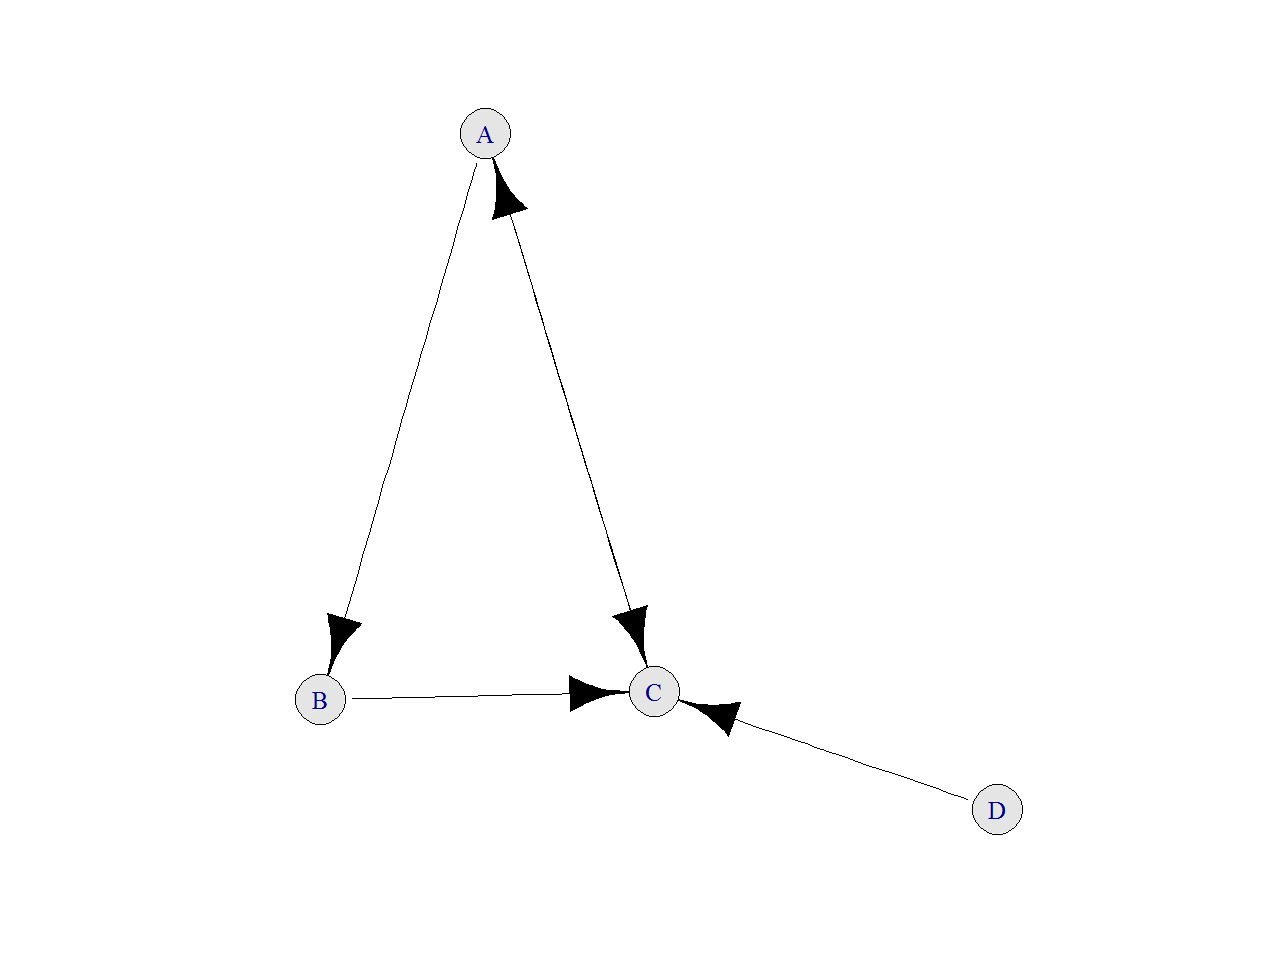
Given a vertex V, these are the steps to calculate its PageRank, lets call it PR(V):

  • Initialize PR(V) to some value (I do it to 1 in my script)
  • Iterate this formula until converges: PR(V)=(1-d)+d*(PR(T1)/C(T1)+ ... +PR(Tn)/C(Tn)) where Ti are the vertex that point to V and C(Ti) is the number of edges going out of Ti

After doing this, result is:

PR2

Following you can find my code to do it with sqldf, which is quite simple from my point of view. I am pretty sure there must be some package which calculates PageRank but the main goal of this post is to show how easy is to calculate it with two simple queries, no more. The example is taken from here, where you can find a good explanation of how PageRank works:

require(sqldf)
require(igraph)
net=data.frame(origin=c("A","A","B","C","D"), end=c("C","B","C","A","C"))
par(family="serif", cex=1, ps=25, bg="white", col.lab="black", col.axis="black")
plot(graph.edgelist(as.matrix(net)), edge.arrow.size=1, vertex.color="gray90", edge.color="black")
#Initialization
netou=sqldf("SELECT origin, COUNT(*) outs FROM net GROUP BY 1")
netpr=sqldf("SELECT origin vertex, 1.0 pagerank FROM net UNION SELECT end, 1.0 FROM net")
for (i in 1:50)
{
netx1=sqldf("SELECT vertex, pagerank/outs factor FROM netou a INNER JOIN netpr b ON (a.origin = b.vertex)")
netpr=sqldf("SELECT a.vertex, 0.15+SUM(0.85*COALESCE(factor,0)) AS pagerank
FROM netpr a LEFT OUTER JOIN net b ON (a.vertex = b.end) LEFT OUTER JOIN netx1 c
ON (b.origin = c.vertex) GROUP BY 1")
}
g=graph.edgelist(as.matrix(net))
names=data.frame(vertex=V(g)$name)
V(g)$name=sqldf("SELECT a.vertex||' (PR='||ROUND(b.pagerank,2)||')' as name from names a inner join netpr b ON (a.vertex=b.vertex)")$name
plot(g, edge.arrow.size=1, vertex.color="gray90", edge.color="black")

Princess Jasmine’s Trick

I’m history! No, I’m mythology! Nah, I don’t care what I am; I’m free hee! (Genie, when he is released from the magical oil lamp by Aladdin)

Princess JasmineA long time ago, in a kingdom far away, lived a beautiful princess named Jasmine. There also lived a very rich and evil wizard named Jafar, who was in love with the princess. In order to married with Jasmine, Jafar bought  her father’s will with treasures, but the princess was harder to convince. One day Jafar told the princess: Request me whatever you want and if  I am able to bring it to you, you will become my wife. The princess, tired of the insistence of Jafar, answered: I only want a gold chain, but I want you to give it to me as follows: the first day I should have just one link of the chain. The second day I should have two links. The third day, three … and so on. When you give me all the links of the chain I will marry you. Jafar, intrigued, asked: But how many links should have the chain?  And Jasmine replied: I want you to give me the longest chain that allows you to pay me breaking only 30 links. Jafar began to laugh out loud as he walked away and said to the princess: Tomorrow I’ll bring you such chain!. But as he went to his palace, his happiness turned into anger: he realized that there was not enough gold in the world to build the chain that asked Jasmine.

This is my own version of one of my favorite anti-common-sense mathematical curiosities. To explain it, let me start with an example. Imagine a simple chain with 7 links. If you open the 3rd link, the you split the chain into 3 pieces: a single link (the one you opened), a piece of 2 links and another one of 4 links. You could pay to Jasmine during seven days combining these 3 pieces:

  • Day 1: Give her the single link
  • Day 2: Give her the 2-links piece and take the single link, leaving her with 2 links
  • Day 3: Give her the single link again, leaving her with 3 links
  • Day 4: Give her the 4-links piece and take all pieces she has, leaving her with 4 links
  • Day 5: Give her the single link again, leaving her with 5 links
  • Day 6: Give her the 2-links piece and take 2-links piece, leaving her with 6 links
  • Day 7: Give her the single link piece, leaving her with all links

Is easy to see that having a chain with 63 links, you could pay Jasmine breaking only 3 links (positions 5th, 14th and 31st). It easy to prove that the length of the biggest chain you can manage breaking only n links is (2n+1-1)*(n+1)+n

Next plot represents the minimum number of breaks to pay Jasmine daily for a given chain’s length. I call it the Jasmine’s Staircase:

Generated With R #rstats

Some curiosities around chains:

  • Jasmine asked Jafar a chain of 66.571.993.087 links
  • Supposing one link weights 4 grams, the chain of Jasmine would weight around 266 tons. It is supposed to be around 171 tons of gold in the world
  • If you spend 1 second to climb the first step of the staircase, you will spend 302 years to climb the step number 100

Jafar was right. Jasmine was clever:

library(sqldf)
library(ggplot2)
library(extrafont)
max.breaks=5
CalculateLength = function(n) {n+sum(sapply(0:n, function(x) 2^x*(n+1)))}
results=data.frame(breaks=1:max.breaks, length=sapply(1:max.breaks, CalculateLength))
links=data.frame(links=2:CalculateLength(max.breaks))
results=sqldf("SELECT links.links, min(results.breaks) as minbreaks FROM links, results WHERE links.links <= results.length GROUP BY 1")
opts=theme(
panel.background = element_rect(fill="mistyrose"),
panel.border = element_rect(colour="black", fill=NA),
axis.line = element_line(size = 0.5, colour = "black"),
axis.ticks = element_line(colour="black"),
panel.grid = element_line(colour="white", linetype = 2),
axis.text.y = element_text(colour="black"),
axis.text.x = element_text(colour="black"),
text = element_text(size=20, family="Humor Sans"),
plot.title = element_text(size = 40)
)
ggplot(results, aes(links,minbreaks))+
geom_area(fill="violet", alpha=.4)+
geom_step(color="violetred", lwd=1.5)+
labs(x="Chain's Length", y="Minimum Number of Breaks", title="Princess Jasmine's Staircase")+
scale_x_continuous(expand = c(0, 0), breaks = sapply(1:max.breaks, CalculateLength))+
opts