Romeo, Juliet, balcony in silhouette, makin o’s with her cigarette, it’s juliet (Flapper Girl, The Lumineers)
Two weeks ago I published this post for which designed two different visualizations. At the end, I decided to place words on the map of the United States. The discarded visualization was this other one, where I place the words over the silhouette of each state:
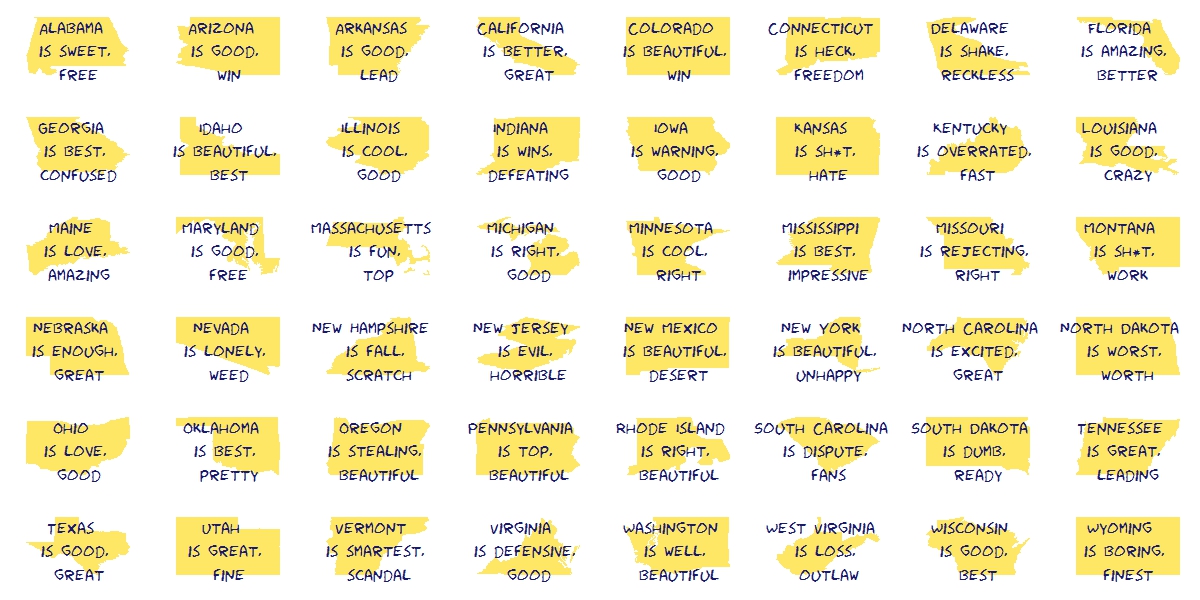
I do not want to set aside this chart because I really like it and also because I think it is a nice example of the possibilities one have working with R.
Here you have the code. It substitutes the fragment of the code headed by “Visualization” of the original post:
library(ggplot2)
library(maps)
library(gridExtra)
library(extrafont)
opt=theme(legend.position="none",
             panel.background = element_blank(),
             panel.grid = element_blank(),
             axis.ticks=element_blank(),
             axis.title=element_blank(),
             axis.text =element_blank(),
             plot.title = element_text(size = 28))
vplayout=function(x, y) viewport(layout.pos.row = x, layout.pos.col = y)
grid.newpage()
jpeg(filename = "States In Two Words.jpeg", width = 1200, height = 600, quality = 100)
pushViewport(viewport(layout = grid.layout(6, 8)))
for (i in 1:nrow(table))
{
  wd=subset(words, State==as.character(table$"State name"[i]))
  p=ggplot() + geom_polygon( data=subset(map_data("state"), region==tolower(table$"State name"[i])), aes(x=long, y=lat, group = group), colour="white", fill="gold", alpha=0.6, linetype=0 )+opt
  print(p, vp = vplayout(floor((i-1)/8)+1, i%%8+(i%%8==0)*8))
  txt=paste(as.character(table$"State name"[i]),"\n is", wd$word1,"\n and", wd$word2, sep=" ")
  grid.text(txt, gp=gpar(font=1, fontsize=16, col="midnightblue", fontfamily="Humor Sans"), vp = viewport(layout.pos.row = floor((i-1)/8)+1, layout.pos.col = i%%8+(i%%8==0)*8))
}
dev.off()