For me, mathematics cultivates a perpetual state of wonder about the nature of mind, the limits of thoughts, and our place in this vast cosmos (Clifford A. Pickover – The Math Book: From Pythagoras to the 57th Dimension, 250 Milestones in the History of Mathematics)
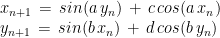
I am a big fan of Clifford Pickover and I find inspiration in his books very often. Thanks to him, I discovered the harmonograph and the Parrondo’s paradox, among many other mathematical treasures. Apart of being a great teacher, he also invented a family of strange attractors wearing his name. Clifford attractors are defined by these equations:
There are infinite attractors, since a, b, c and d are parameters. Given four values (one for each parameter) and a starting point (x0, y0), the previous equation defines the exact location of the point at step n, which is defined just by its location at n-1; an attractor can be thought as the trajectory described by a particle. This plot shows the evolution of a particle starting at (x0, y0)=(0, 0) with parameters a=-1.24458046630025, b=-1.25191834103316, c=-1.81590817030519 and d=-1.90866735205054 along 10 million of steps:

Changing parameters is really entertaining. Drawings have a sandy appearance:


From a technical point of view, the challenge is creating a data frame with all locations, since it must have 10 milion rows and must be populated sequentially. A very fast way to do it is using Rcpp package. To render the plot I use ggplot, which works quite well. Here you have the code to play with Clifford Attractors if you want:
library(Rcpp)
library(ggplot2)
library(dplyr)

opt = theme(legend.position  = "none",
            panel.background = element_rect(fill="white"),
            axis.ticks       = element_blank(),
            panel.grid       = element_blank(),
            axis.title       = element_blank(),
            axis.text        = element_blank())

cppFunction('DataFrame createTrajectory(int n, double x0, double y0,
            double a, double b, double c, double d) {
            // create the columns
            NumericVector x(n);
            NumericVector y(n);
            x[0]=x0;
            y[0]=y0;
            for(int i = 1; i < n; ++i) {
            x[i] = sin(a*y[i-1])+c*cos(a*x[i-1]);
            y[i] = sin(b*x[i-1])+d*cos(b*y[i-1]);
            }
            // return a new data frame
            return DataFrame::create(_["x"]= x, _["y"]= y);
            }
            ')

a=-1.24458046630025
b=-1.25191834103316
c=-1.81590817030519
d=-1.90866735205054

df=createTrajectory(10000000, 0, 0, a, b, c, d)

png("Clifford.png", units="px", width=1600, height=1600, res=300)
ggplot(df, aes(x, y)) + geom_point(color="black", shape=46, alpha=.01) + opt
dev.off()
Beautiful images,
wondering if there is a 3D version to display with “rgl”
I did once a post about The Harmonograph and someone asked himself the same question. He generalized the concept to 3D and result was really impressive. We did a post together to show it: https://fronkonstin.com/2014/11/11/3d-harmonographs-in-motion/ May you try to do something similar with this? 😉 Thank you very much!
These are great – I had good fun playing with your code. I adapted it to randomise a, b, c, and d. I also played around with colours, splitting the data frame into two parts and plotting them over one another. This wasn’t as spectacular as I’d hoped, it mostly just merged the two colours. Can you think of any other ways to make them more colourful?
Maybe you may try with Colourlovers package (nice colour combinations) or giving colors depending on angle from (0,0) or just combining two simple dark/light colors for points and background to make contrast. Thanks!
These are amazing and beautiful.
Thank you! 🙂
For those that are curious, a pure R solution takes around 4.2 seconds or so to run the same loop. The Rcpp solution posted above takes 0.6 seconds! ~7x increase with this minimal effort conversion of the loop to Rcpp. Pretty impressive! For full reproducibility, here is the code for the pure R solution.
https://gist.github.com/DavisVaughan/549334145e3f38bf31c205295f59e788
In my case, your loop takes 51 seconds! Thanks for your comment
I assume your 51 seconds refers to the whole script not the llop only. With me the loop, i.e the generation of the data-frame, takes 4.3 seconds in pure R, and 1.2 seconds with Rcpp. ggplot2 takes another ~38 seconds.
It is obvious, that Davis Vaughan didn’t plot his values. Else he would have realized that the parentheses in his code are different from the C-Code.
Hi! Very nice images! Is it okay if I use some of them in this page?: http://www.cmat.edu.uy/
It’s ok, sure! Thanks
Here’s a version using Python’s Datashader: https://anaconda.org/jbednar/clifford_attractor/notebook
Using Numba to JIT-compile pure Python computes the 10 million coordinates in 1 second, and then plotting them takes half a second. Plus Datashader’s histogram equalization makes a clear plot of them with no adjustment to any plotting parameters.