Every even integer greater than 2 can be expressed as the sum of two primes (Christian Goldbach, 1742)
The point cloud known as Goldbach’s Comet represents the amount of different ways (y axis) an even number (x axis) can be writen as sum of two prime numbers. In this plot, x axis is between 2 and 50.000 (stars are just ornaments):
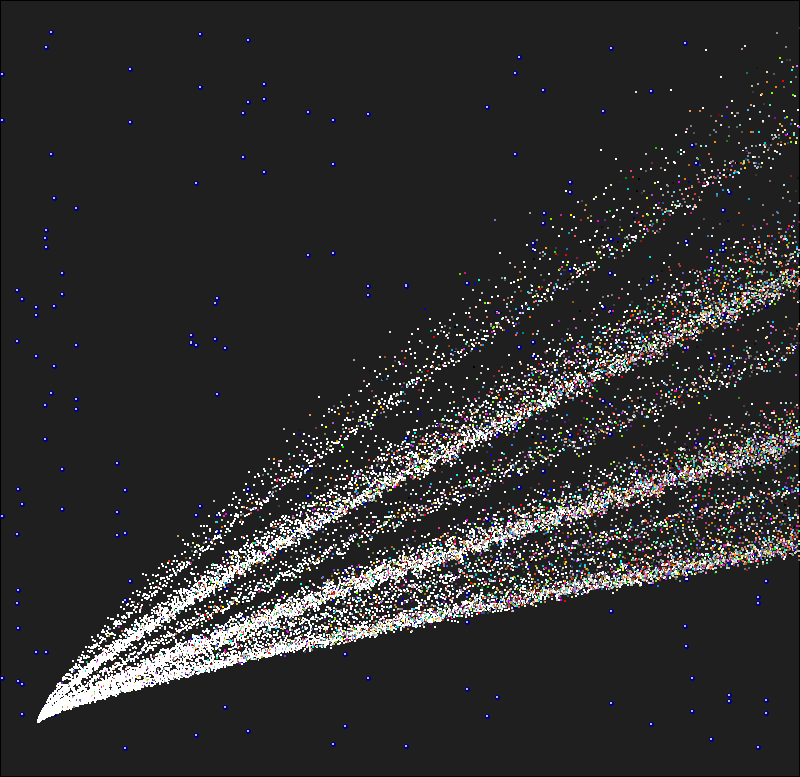
Mathematicians are still waiting for a proof of this conjecture. This is the code for drawing this plot:
require(schoolmath)
require(utils)
library(plyr)
n=50000
data(primlist)
primes=as.data.frame(t(combn(primlist[primlist>2 & primlist<n-2], 2)))
primes$V3=primes$V1+primes$V2
primes2=count(primes, "V3")
primes2=primes2[primes2$V3<=n,]
stars=cbind(runif(50, min=-n*0.05, max=n), runif(200, min=-n*0.001, max=max(primes2$freq)))
plot.new()
par(mai = rep(0, 4), bg = "gray12")
plot(NA,type="n", xlim=c(-n*0.05,n), xaxs="i", ylim=c(-n*0.001,max(primes2$freq)))
points(stars, col = "blue4", cex=.7, pch=16)
points(stars, col = "blue", cex=.3, pch=16)
points(stars, col = "gray75", cex=.1, pch=16)
apply(primes2, 1, function(x) points(x=x[1],y=x[2], col = if (runif(1)>x[1]/n) {"white"} else {sample(colours(),1)}, cex=.1, pch=16))