Prediction is difficult, especially of the future (Mark Twain)
Let me start with two important premises. First of all, I am not into football so I do not support any team. Second, this post is just an opinion based on mathematics but football, as all of you know, is not an exact science. Football is football.
This is a good moment to analyse Spanish Liga of football. F. C. Barcelona and Atletico de Madrid share first place of the championship followed closely by Real Madrid. But analysing results over the time can give us an interesting insight about capabilities of top three teams.
I have run a Bradley-Terry model for pairwise comparisons. The Bradley-Terry model deals with a situation in which n individuals or items are compared to one another in paired contests. In my case the model uses confrontations and its results as input. The Bradley-Terry model (Bradley and Terry 1952) assumes that in a contest between any two players, say player i and player j, the odds that i beats j are xi/xj, where xi and xj are positive-valued parameters which might be thought of as representing ability.
Time plays a key role in my analysis. This is what happens when you estimate abilities of top three teams over the time:

After 20 rounds, Atletico de Madrid and Barcelona have the same estimated ability but while Barcelona is continuosly losing ability since the beginning, Atletico de Madrid presents a robust or even growing evolution. Of course, it depends on how both teams begun the championship. The higher you start, the more you can lose; but watching this graph I can not help feeling that Atletico de Madrid keep their morale higher than Barcelona.
Another interesting output of the Bradley-Terry model are estimated probabilites of beating teams each others. Since these probabilities depends on previous abilities, Barcelona and Atletico de Madrid have same chances of winning a hypothetical match. But once again, evolution of these probabilities can change our perception:
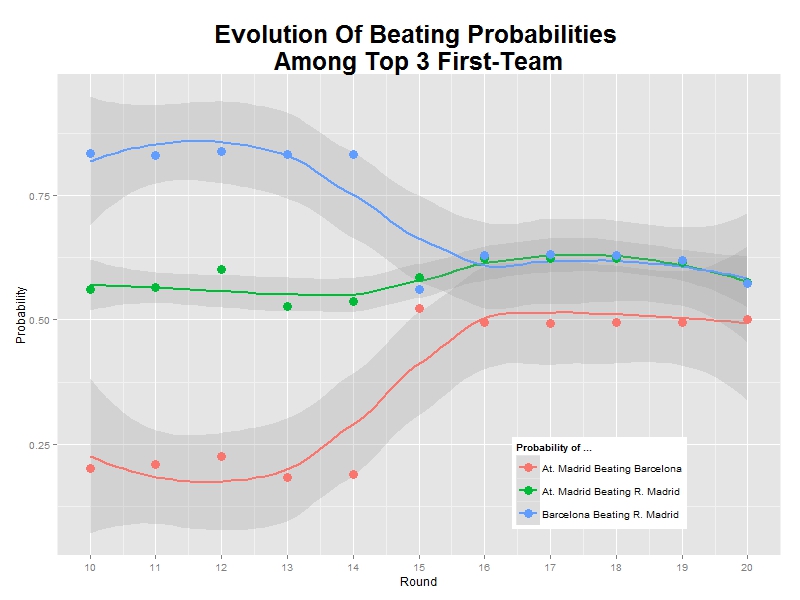
As you can see, Atletico de Madrid has increased the probability of beating Barcelona from 0.25 to 0.50 in just one round and Barcelona has lost more than this probability in the same time. Once again, it seems that Atletico de Madrid is increasingly confidence time by time. And confidence is important in this game. Luckily, football is unpredictable but after taking time into account I dare to say that Atletico de Madrid will win the championship. I am pretty sure.
Here you have the code I wrote for the analysis. Maybe you would like to make your own predictions:
library("BradleyTerry2")
library("xlsx")
library("ggplot2")
library("reshape")
football <-read.xlsx("CalendarioLiga2013-14 2.xls", sheetName= "results", header=TRUE)
inv_logit <- function(p) {exp(p) / (1 + exp(p))}
prob_BT   <- function(ability_1, ability_2) {inv_logit(ability_1 - ability_2)}
rounds <- sort(unique(football$round))
# Initialization
football.pts.ev <- as.data.frame(c())
football.abl.ev <- as.data.frame(c())
football.prb.ev <- as.data.frame(c())
# Points evolution: football.pts.ev
for (i in 1:length(rounds))
{
  football.home <-aggregate( home.wins ~ home.team, data=football[football$round<=rounds[i],], FUN=sum)
  colnames(football.home) <- c('Team', 'Points')
  football.away <-aggregate( away.wins ~ away.team, data=football[football$round<=rounds[i],], FUN=sum)
  colnames(football.away) <- c('Team', 'Points')
  football.all <-rbind(football.home,football.away)
  football.points <-aggregate( Points ~ Team, data=football.all, FUN=sum)
  football.points$round<-rounds[i]
  football.pts.ev <- rbind(football.points, football.pts.ev)
}
# BT Models
# Abilities and probabilities evolution: football.abl.ev and football.prb.ev
# We start from 6th. round to have good information
for (i in 6:length(rounds))
{
  footballBTModel      <- BTm(cbind(home.wins, away.wins), home.team, away.team, data = football[football$round<=rounds[i],], id = "team")
  team_abilities       <- data.frame(BTabilities(footballBTModel))$ability
  names(team_abilities) <-unlist(attr(BTabilities(footballBTModel), "dimnames")[1][1])
  team_probs           <- outer(team_abilities, team_abilities, prob_BT)
  diag(team_probs)     <- 0
  team_probs           <- melt(team_probs)
  colnames(team_probs) <- c('team', 'adversary', 'probability')
  team_probs$round<-rounds[i]
  football.prb.ev <- rbind(team_probs, football.prb.ev)
  football.abl.ev.df <- data.frame(rownames(data.frame(BTabilities(footballBTModel))),BTabilities(footballBTModel))
  football.abl.ev.df$round<-rounds[i]
  colnames(football.abl.ev.df) <- c('team', 'ability', 's.e.', 'round')
  football.abl.ev <- rbind(football.abl.ev.df, football.abl.ev)
}
# Probabilities of top 3 teams
football.prb.ev.3 <- football.prb.ev[
    ((football.prb.ev$team == "At. Madrid" & football.prb.ev$adversary == "R. Madrid")|
     (football.prb.ev$team == "At. Madrid" & football.prb.ev$adversary == "Barcelona")|
     (football.prb.ev$team == "Barcelona"  & football.prb.ev$adversary == "R. Madrid"))&
      football.prb.ev$round>=10, ]
football.prb.ev.3$teambyadver <- interaction(football.prb.ev.3$team, football.prb.ev.3$adversary, sep = " Beating ")
# Abilities of top 3 teams
football.abl.ev.3 <- football.abl.ev[(football.abl.ev$team == "At. Madrid" |
                                     football.abl.ev$team == "R. Madrid"  |
                                     football.abl.ev$team == "Barcelona")&
                                     football.abl.ev$round>=10, ]
ggplot(data = football.prb.ev.3, aes(x = round, y = probability, colour = teambyadver)) +
  stat_smooth(method = "loess", formula = y ~ x, size = 1, alpha = 0.25)+
  geom_point(size = 4) +
  theme(legend.position = c(.75, .15))+
  labs(list(x = "Round", y = "Probability"))+
  labs(colour = "Probability of ...")+
  ggtitle("Evolution Of Beating Probabilities \nAmong Top 3 First-Team") +
  theme(plot.title = element_text(size=25, face="bold"))+
  scale_x_continuous(breaks = c(10,11,12,13,14,15,16,17,18,19,20))
ggplot(data = football.abl.ev.3, aes(x = round, y = ability, colour = team)) +
  stat_smooth(method = "loess", formula = y ~ x, size = 1, alpha = 0.25)+
  geom_point(size = 4) +
  theme(legend.position = c(.75, .75))+
  labs(list(x = "Round", y = "Ability"))+
  labs(colour = "Ability of ...")+
  ggtitle("Evolution Of Abilities \nOf Top 3 First-Team") +
  theme(plot.title = element_text(size=25, face="bold"))+
  scale_x_continuous(breaks = c(10,11,12,13,14,15,16,17,18,19,20))
This study is crazy… Atletico won’t win this league. No way.
Can you tell me your reasons? Thanks for your comment 🙂
lol
Good job!
Can you please provide the data (CalendarioLiga2013-14 2.xls)?
I have two question on this topic which I find certainly amazing: (1) It is not clear to me which kind of data (sources) you are using to achieve these conclusions, and (2) Would it be possible to make the same study for season 2012-2013 and see to what extent it is able to predict the winner?
In addition, my understanding is that there is an assumption on this result (please correct me if I am wrong). This assumptions relies on that ATM, FCB and RMA will win any other match with the rest of the teams, since in my opinion the text states that based on the matches between these former three teams you are able to predict that ATM is to win.
Otherwise, I do not see where you consider the possibility of losing/winning against/to other teams.
And one last question: I do not understand which is the ’rounds’ used for? Is it the numbers of ‘matches’ and the evolution along these matches?
Thank you in advance.
quite a brilliant prediction. So does the Bradley-Terry model let us extrapolate and quantify future predictions or does it only allow us to quantify events that have already taken place?
Thanks in advance