Control is what we already know. Control is where we have already ventured. Control is what helps us predict the future. (Merkbar)
Maths and music get along very well. Last December I received a mail from a guy called Jesper. He is one of the two members of Merkbar: a electronic music band from Denmark. As can be read in their website:
Merkbar is Jesper and David who are both interested in the psychedelic worlds and oriental spiritualism. They both studied Computer Music, where they’ve done research in sound synthesis, generative composition and the design of new digital instrument.
They asked me a front cover for their new album which will be released at the beginning of 2015. Why? Because they liked this post I did about circlizing numbers. To do this plot I circlized the Golden Ratio number (Phi). But in this case I changed ribbons (all equal pairs of consecutive numbers gather together) by lines (every pair of consecutive numbers form a different line). As I did before, I used circlize package, which implements in R the features of Circos, a software to create stunning circular visualizations.
The final plot represents the first 2.000 digits of Phi:
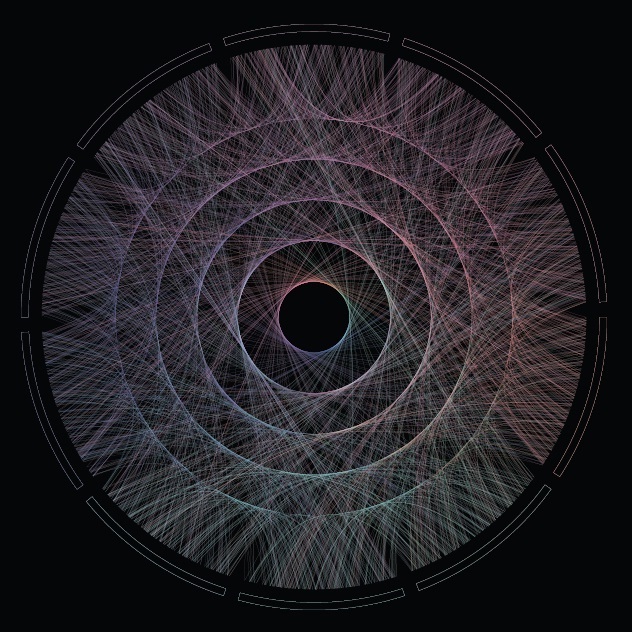
You can hear an advancement of their new album here, which is called “Phi”. Enjoy their sensitive and full-of-shades music: you will be delightfully surprised as I was.
This is the code to circlize Phi:
library(circlize)
library(scales)
factors = as.factor(0:9)
lines = 2000 #Number of lines to plot in the graph
alpha = 0.4  #Alpha for color lines
colors0=c(rgb(239,143,121, max=255), rgb(126,240,188, max=255), rgb(111,228,235, max=255),
          rgb(127,209,249, max=255), rgb( 74,106,181, max=255), rgb(114,100,188, max=255),
          rgb(181,116,234, max=255), rgb(226,135,228, max=255), rgb(239,136,192, max=255),
          rgb(233,134,152, max=255))
#You can find the txt file here: http://www.goldennumber.net/wp-content/uploads/2012/06/Phi-To-100000-Places.txt
phi=readLines("Phi-To-100000-Places.txt")[5]
phi=gsub("\\.","", substr(phi,1,lines))
phi=gsub("\\.","", phi)
position=1/(nchar(phi)-1)
#This code generates a pdf file in your working directory
pdf(file="CirclizePhi.pdf", width=25, height=25)
circos.clear()
par(mar = c(1, 1, 1, 1), lwd = 0.1, cex = 0.7, bg=alpha("black", 1))
circos.par("cell.padding"=c(0.01,0.01), "track.height" = 0.025, "gap.degree" = 3)
circos.initialize(factors = factors, xlim = c(0, 1))
circos.trackPlotRegion(factors = factors, ylim = c(0, 1))
for (i in 0:9) {circos.updatePlotRegion(sector.index = as.character(i), bg.col = alpha("black", 1), bg.border=alpha(colors0[i+1], 1))}
for (i in 1:(nchar(phi)-1)) {
  m=min(as.numeric(substr(phi, i, i)), as.numeric(substr(phi, i+1, i+1)))
  M=max(as.numeric(substr(phi, i, i)), as.numeric(substr(phi, i+1, i+1)))
  d=min((M-m),((m+10)-M))
  col=t(col2rgb(colors0[(as.numeric(substr(phi, i, i))+1)]))
  if (col[1]>255) col[1]=255;if (col[2]>255) col[2]=255;if (col[3]>255) col[3]=255
  if (col[1]<0) col[1]=0;if (col[2]<0) col[2]=0;if (col[3]<0) col[3]=0 if (d>0) circos.link(substr(phi, i, i), position*(i-1), substr(phi, i+1, i+1), position*i, h = 0.1375*d+0.1125, lwd=0, col=alpha(rgb(col, max=255), alpha), rou = 0.92)
}
dev.off()