Tag Archives: maths

Kites and Darts: the Penrose Tiling

Agarrada a mis costillas le cuelgan las piernas (Godzilla, Leiva)

Penrose tilings are amazing. Apart of the inner beauty of tesselations, they have two interesting properties: they are non-periodic (they lack any translational symmetry) and self-similar (any finite region appears an infinite number of times in the tiling). Both characteristics make them a kind of chaotical as well as ordered mathematical object that make them really appealing.

In this experiment I create Penrose tilings. Concretely, the P2 tiling, according to this article from Simon Tatham, that I will follow and provides a perfect explanation of how these tessellations can be constructed. The code is available here, and you can use it to create Penrose tilings like this one:

I will not explain in depth how to build the P2 tiling, since the article I mentioned before does it perfectly. Instead of that, I will give some highlights of the process together with a brief explanation of the code involved in it.

Everything has to do with triangles. Concretely, everything has to do with two types of triangles. To differenciate them I name their sides with numbers. The first triangle has labels 1, 2 and 3 and the other one has labels 1, 2 and 4. Two triangles of type 123 forms a kyte like this:

On the other hand, two triangles of type 124 forms a dart like this:

Actually, kites and darts don’t contain their inner segments so both of them are polygons of 4 sides. The building of a Penrose tiling is an iterative process that begins with 5 kites (i.e. 10 triangles of type 123) gathered like this:

You can start with many other patterns but this one will result in a round shape tiling and I like it. I build the tiling by subdividing triangles as Simon describes in his article. A triangle of type 123 is subdivided into three triangles: two of type 123 and one of type 124. The following image shows a 123 triangle (left) and the result after its division (right):

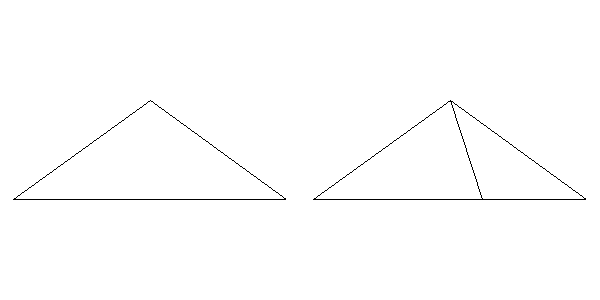
A triangle of type 124 is subdivided into two triangles: one of type 123 and one of type 124. The following image shows a 124 triangle (left) and the result after its division (right):

In each iteration, all triangles are subdivided according its type. After 5 iterations, the resulting pattern is like this:

To make calculations easier I arranged the data frame following a segment structure, in which the sides of triangles are defined by two coordinates: (x, y) and (xend, yend). The bad side of it is that I have rounding problems after making some iterations. It makes the points that would be the same differs slightly because they come from different triangles. I fix it using a hierarchical clustering and substituting points by its centroids after cutting up the dendogram using a very low thresold. Once this problem is solved I can remove the inner segments of all kites and darts, which are segments of type 3 or 4. Apart of removing them, I join the xx triengles to form 4-sides polygons. All these tasks are done with the function Arrange_df (remember that the code is here). This is the result:

This pattern is quite similar to its previous one but now the data frame is ready to be arranged as a polygon using the function Create_Polygon. At least, I calculate the area of each polygon with the Shoelace formula to create a columns called area which I use to fill polygons with two nice colors.

I hope that these explanations will help you to understand and improve the code as well as to invite you to create your own Penrose tilings.

Tweetable Mathematical Art With R

Sin ese peso ya no hay gravedad
Sin gravedad ya no hay anzuelo
(Mira cómo vuelo, Miss Caffeina)

I love messing around with R to generate mathematical patterns. I always get surprised doing it and gives me lot of satisfaction. I also learn lot of things doing it: not only about R, but also about mathematics. It is one of my favourite hobbies. Some time ago, I published this post showing some drawings, each of them generated with less than 280 characters of code, to be shared on Twitter. This post came to appear in Hacker News, which provoked an incredible peak on visits to my blog. Some comments in the Hacker News entry are very interesting.

This Summer I delved into this concept of Tweetable Art publishing several drawings together with the R code to generate them. In this post I will show some.

Vertiginous Spiral

I came up with this image inspired by this nice pattern. It is a turtle graphic inspired pattern but instead of drawing lines I use geom_polygon to colour the resulting image in black and white:

Code:

library(tidyverse)
df <- data.frame(x=0, y=0)
for (i in 2:500){
  df[i,1] <- df[i-1,1]+((0.98)^i)*cos(i)
  df[i,2] <- df[i-1,2]+((0.98)^i)*sin(i)   
}
ggplot(df, aes(x,y)) + 
  geom_polygon()+
  theme_void()

Slight modifications of the code can generate appealing patterns like this:

Marine Creature

A combination of sines and cosines. It reminds me a jellyfish:

Code:

library(tidyverse)
seq(from=-10, to=10, by = 0.05) %>%
  expand.grid(x=., y=.) %>%
  ggplot(aes(x=(x^2+pi*cos(y)^2), y=(y+pi*sin(x)))) +
  geom_point(alpha=.1, shape=20, size=1, color="black")+
  theme_void()+coord_fixed()

Summoning Cthulhu

The name is inspired in an answer from Mara Averick to this tweet. It is a modification of the marine creature in polar coordinates:

Code:

library(tidyverse)
seq(-3,3,by=.01) %>%
  expand.grid(x=., y=.) %>%
  ggplot(aes(x=(x^3-sin(y^2)), y=(y^3-cos(x^2)))) +
  geom_point(alpha=.1, shape=20, size=0, color="white")+
  theme_void()+
  coord_fixed()+
  theme(panel.background = element_rect(fill="black"))+
  coord_polar()

Naive Sunflower

Sunflowers arrange their seeds according a mathematical pattern called phyllotaxis, whic inspires this image. If you want to create your own flowers, you can do this Datacamp’s project. It’s free and will introduce you to the amazing world of ggplot2, my favourite package to create images:

Code:

library(ggplot2)
a=pi*(3-sqrt(5))
n=500
ggplot(data.frame(r=sqrt(1:n),t=(1:n)*a),
       aes(x=r*cos(t),y=r*sin(t)))+
  geom_point(aes(x=0,y=0),
             size=190,
             colour="violetred")+
  geom_point(aes(size=(n-r)),
             shape=21,fill="gold",
             colour="gray90")+
  theme_void()+theme(legend.position="none")

Silk Knitting

It is inspired by this other pattern. A lot of almost transparent white points ondulating according to sines and cosines on a dark coloured background:

Code:

library(tidyverse)
seq(-10, 10, by = .05) %>%
  expand.grid(x=., y=.) %>%
  ggplot(aes(x=(x+sin(y)), y=(y+cos(x)))) +
  geom_point(alpha=.1, shape=20, size=0, color="white")+
  theme_void()+
  coord_fixed()+
  theme(panel.background = element_rect(fill="violetred4"))

Try to modify them and generate your own patterns: it is a very funny way to learn R.

Note: in order to make them better readable, some of the pieces of code below may have more than 280 characters but removing unnecessary characters (blanks or carriage return) you can reduce them to make them tweetable.