Tag Archives: Harmonograph

The Ex Libris Generator

Go ahead stomp your feet on the floorboards
Clap your hands if that’s really what you came here for
(Heaven, The Milk Carton Kids)

Inspired by curves created by the harmonograph, I have done a Shiny app to generate random images that you can personalize and use as an Exlibris.  You can try the App here. For me, an exlibris (also known as bookplates) can be a nice, original and useful present for book-lovers. This is an example:
exlibris8
More examples:

I always put the code at the end of my posts. Since I always have doubts about how many people are interested in what I do, today will be different. I will share the code with those who ask it to me in any of the following ways:

  • Sending me a direct message on Twitter
  • Droping me an email

Cheers!

Three Shiny Apps to Celebrate the Beauty of Maths

Mathematics knows no races or geographic boundaries; for mathematics, the cultural world is one country (David Hilbert)

One of the best decisions I took this year related with this blog was to move it to my own self-hosted domain using WordPress.org. It allows to me, for example, to embed dynamic JavaScript visualizations like this one. Another thing I can do now is to upload my Shiny Apps to share them with my readers. In this post I have gathered three Apps I made some time ago; you can play with them as well as get the code I wrote for each one:

  • The Harmonograph: This App simulates harmonograph drawings. An harmonograph is a mechanism which draws trajectories by means of two pendulums: one moves a pencil and the other one moves a platform with a piece of paper on it. Click here to try it.
  • Shiny Wool Skeins: This App, inspired by this post, creates a plot consisting of chords inside a circle . You can change colors as well as the number and quality of the chords. Click here to try it.
  • The Coaster Maker: With this App you can create your own coasters using hypocicloids. Click here to try it.

I want to thank to my friend Jorge, without whom I would not have been able to make Shiny work in my server.

Gummy Worms

Just keep swimming (Dory in Finding Nemo)

Inspired by this post, I decided to create gummy worms like this:

worm
Or these:

When I was young I used to eat them.

Do you want to try? This is the code:

library(rgl)
library(RColorBrewer)
t=seq(1, 6, by=.04)
f = function(a, b, c, d, e, f, t) exp(-a*t)*sin(t*b+c)+exp(-d*t)*sin(t*e+f)
v1=runif(6,0,1e-02)
v2=runif(6, 2, 3)
v3=runif(6,-pi/2,pi/2)
open3d()
spheres3d(x=f(v1[1], v2[1], v3[1], v1[4], v2[4], v3[4], t),
          y=f(v1[2], v2[2], v3[2], v1[5], v2[5], v3[5], t),
          z=f(v1[3], v2[3], v3[3], v1[6], v2[6], v3[6], t),
          radius=.3, color=sample(brewer.pal(8, "Dark2"),1))

The 2D-Harmonograph In Shiny

If you wish to make an apple pie from scratch, you must first invent the universe (Carl Sagan)

I like Shiny and I can’t stop converting into apps some of my previous experiments: today is the turn of the harmonograph. This is a simple application since you only can press a button to generate a random harmonograph-simulated curve. I love how easy is to create a nice interactive app to play with from an existing code. The only trick in this case in to add a rerun button in the UI side and transfer the interaction to the server side using a simple if. Very easy. This is a screenshot of the application:

Shiny_2DHarmonograph

Press the button and you will get a new drawing. Most of them are nice scrawls and from time to time you will obtain beautiful shapely curves.

And no more candy words: It is time to complain. I say to RStudio with all due respect, you are very cruel. You let me to deploy my previous app to your server but you suspended it almost immediately for fifteen days due to “exceeded usage hours”. My only option is paying at least $440 per year to upgrade my current plan. I tried the ambrosia for an extremely short time. RStudio: Why don’t you launch a cheaper account? Why don’t you launch a free account with just one perpetual alive app at a time? Why don’t you increase the usage hours threshold? I can help you to calculate the return on investment of these scenarios.

Or, Why don’t you make me a gift for my next birthday? I promise to upload a new app per month to promote your stunning tool. Think about it and please let me know your conclusions.

Meanwhile I will run the app privately. This is the code to do it:

UI.R

# This is the user-interface definition of a Shiny web application.
# You can find out more about building applications with Shiny here:
# 
# http://www.rstudio.com/shiny/
 
library(shiny)
 
shinyUI(fluidPage(
  titlePanel("Mathematical Beauties: The Harmonograph"),
  sidebarLayout(
    sidebarPanel(
      #helpText(),
 
      # adding the new div tag to the sidebar            
      tags$div(class="header", checked=NA,
               tags$p("A harmonograph is a mechanical apparatus that employs pendulums to create a 
                       geometric image. The drawings created typically are Lissajous curves, or 
                       related drawings of greater complexity. The devices, which began to appear 
                       in the mid-19th century and peaked in popularity in the 1890s, cannot be 
                       conclusively attributed to a single person, although Hugh Blackburn, a professor 
                       of mathematics at the University of Glasgow, is commonly believed to be the official 
                       inventor. A simple, so-called \"lateral\" harmonograph uses two pendulums to control the movement 
                       of a pen relative to a drawing surface. One pendulum moves the pen back and forth along 
                       one axis and the other pendulum moves the drawing surface back and forth along a 
                       perpendicular axis. By varying the frequency and phase of the pendulums relative to 
                       one another, different patterns are created. Even a simple harmonograph as described 
                       can create ellipses, spirals, figure eights and other Lissajous figures (Source: Wikipedia)")),
               tags$div(class="header", checked=NA,
                       HTML("

Click <a href=\"http://paulbourke.net/geometry/harmonograph/harmonograph3.html\">here</a> to see an image of a real harmonograph

")
               ),
        actionButton('rerun','Launch the harmonograph!')
    ),
    mainPanel(
      plotOutput("HarmPlot")
    )
  )
))

server.R

# This is the server logic for a Shiny web application.
# You can find out more about building applications with Shiny here:
# 
# http://www.rstudio.com/shiny/
# 
 
library(shiny)
 
CreateDS = function () 
  {
   
  f=jitter(sample(c(2,3),4, replace = TRUE))
  d=runif(4,0,1e-02)
  p=runif(4,0,pi)
  xt = function(t) exp(-d[1]*t)*sin(t*f[1]+p[1])+exp(-d[2]*t)*sin(t*f[2]+p[2])
  yt = function(t) exp(-d[3]*t)*sin(t*f[3]+p[3])+exp(-d[4]*t)*sin(t*f[4]+p[4])
  t=seq(1, 200, by=.0005)
  data.frame(t=t, x=xt(t), y=yt(t))}
 
shinyServer(function(input, output) {
    dat<-reactive({if (input$rerun) dat=CreateDS() else dat=CreateDS()})
 output$HarmPlot<-renderPlot({
   plot(rnorm(1000),xlim =c(-2,2), ylim =c(-2,2), type="n")
   with(dat(), plot(x,y, type="l", xlim =c(-2,2), ylim =c(-2,2), xlab = "", ylab = "", xaxt='n', yaxt='n', col="gray10", bty="n"))
  }, height = 650, width = 650)
})

3D-Harmonographs In Motion

I would be delighted to co write a post (Andrew Wyer)

One of the best things about writing a blog is that occasionally you get to know very interesting people. Last October 13th I published this post about the harmonograph, a machine driven by pendulums which creates amazing curves. Two days later someone called Andrew Wyer made this comment about the post:

Hi, I was fascinated by the harmonographs – I remember seeing similar things done on paper on kids tv in the seventies. I took your code and extended it into 3d so I could experiment with the rgl package. I created some beautiful figures (which I would attach if this would let me). In lieu of that here is the code:

I ran his code and I was instantly fascinated: resulting curves were really beautiful. I suggested that we co-write a post and he was delighted with the idea. He proposed to me the following improvement of his own code:

I will try to create an animated gif of one figure

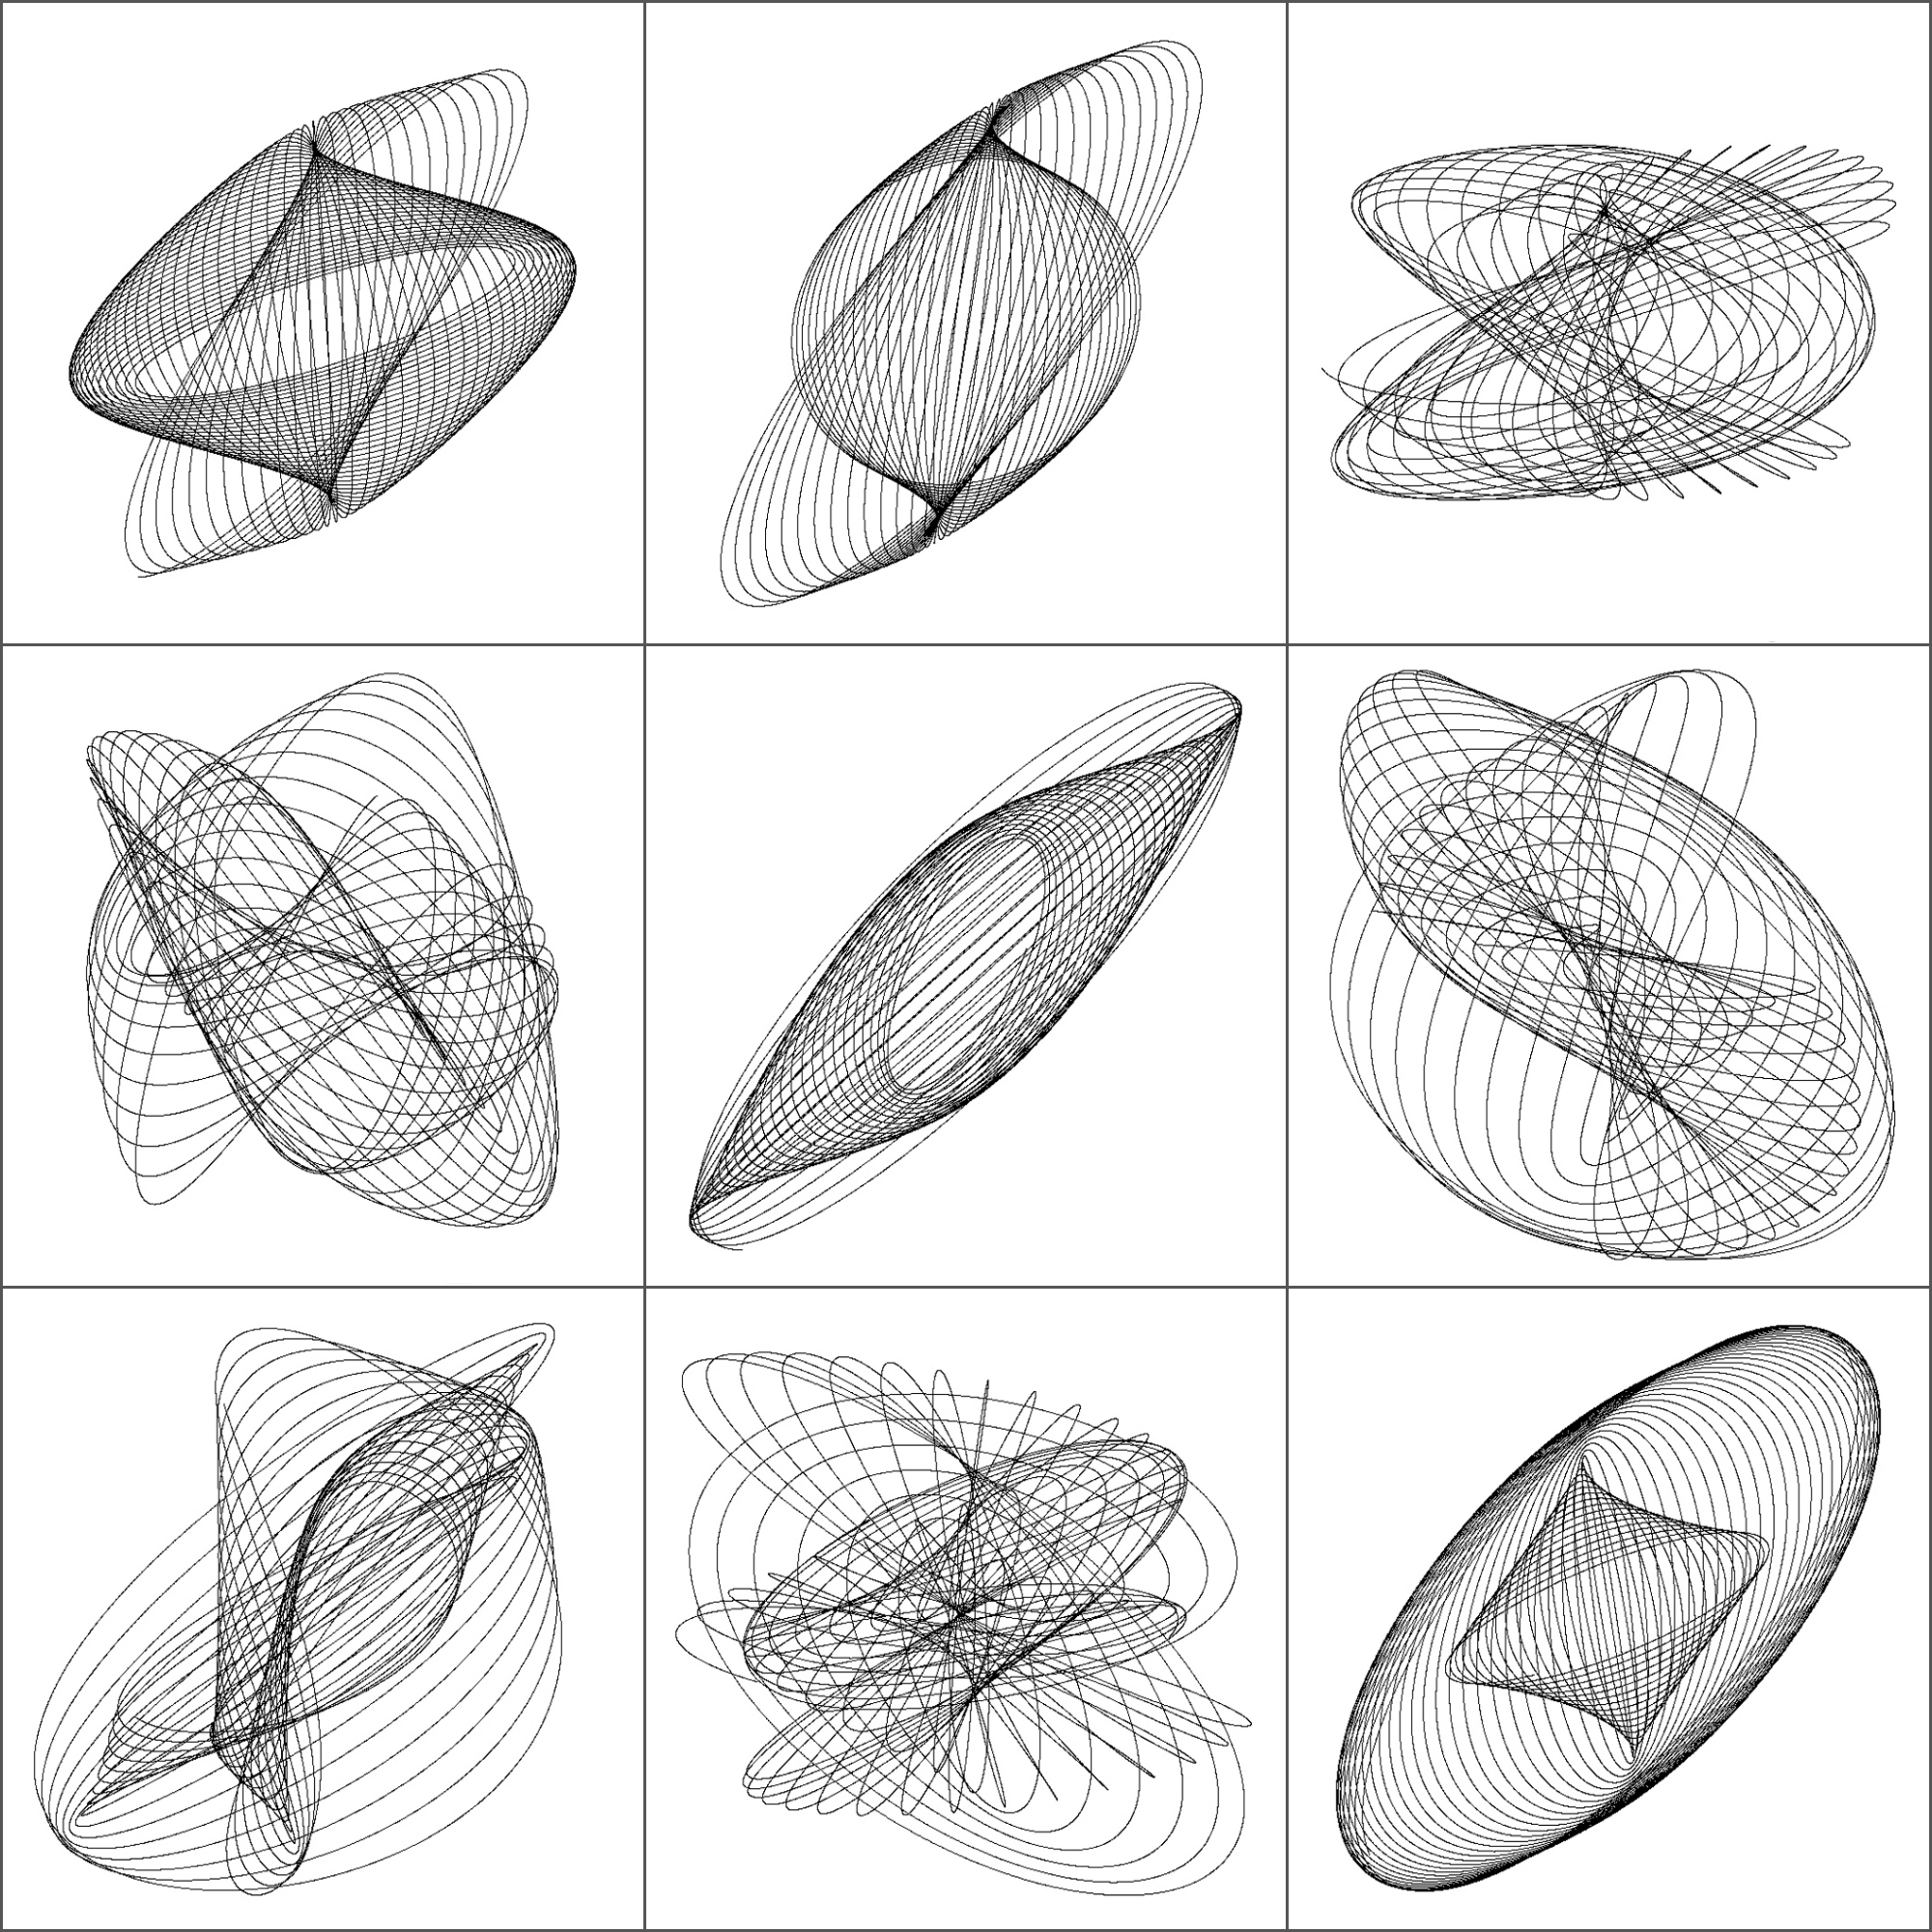
Such a good idea! And no sooner said than done: Andrew rewrote his own code to create stunning animated images of 3D-Harmonograph curves like these:

movie

5hd

6hd

Some keys about the code:

  • Andrew creates 3D curves by adding a third oscillation z generated in the same way as x and y and adds a little colour by setting the colour of each point to a colour in the RGB scale related to its point in 3d space
  • Function spheres3d to produce an interactive plot that you can drag around to view from different angles; function spin3d will rotate the figure around the z axis and at 5 rpm in this case and function movie3d renders each frame in a temporary png file and then calls ImageMagick to stitch them into an animated gif file. It is necessary to install ImageMagick separately to create the movie.
  • Giving it a duration of 12 seconds at 5 rpm is one rotation which at 12 frames per second results in 144 individual png files but these (by default) are temporary and deleted when the gif is produced.

Although I don’t know Andrew personally, I know he is a good partner to work with. Thanks a lot for sharing this work of art with me and allowing me to share it in Ripples as well.

Here you have the code. I like to imagine these curves as orbits of unexplored planets in a galaxy far, far away …

library(rgl)
library(scatterplot3d)
#Extending the harmonograph into 3d
#Antonio's functions creating the oscillations
xt = function(t) exp(-d1*t)*sin(t*f1+p1)+exp(-d2*t)*sin(t*f2+p2)
yt = function(t) exp(-d3*t)*sin(t*f3+p3)+exp(-d4*t)*sin(t*f4+p4)
#Plus one more
zt = function(t) exp(-d5*t)*sin(t*f5+p5)+exp(-d6*t)*sin(t*f6+p6)
#Sequence to plot over
t=seq(1, 100, by=.001)
#generate some random inputs
f1=jitter(sample(c(2,3),1))
f2=jitter(sample(c(2,3),1))
f3=jitter(sample(c(2,3),1))
f4=jitter(sample(c(2,3),1))
f5=jitter(sample(c(2,3),1))
f6=jitter(sample(c(2,3),1))
d1=runif(1,0,1e-02)
d2=runif(1,0,1e-02)
d3=runif(1,0,1e-02)
d4=runif(1,0,1e-02)
d5=runif(1,0,1e-02)
d6=runif(1,0,1e-02)
p1=runif(1,0,pi)
p2=runif(1,0,pi)
p3=runif(1,0,pi)
p4=runif(1,0,pi)
p5=runif(1,0,pi)
p6=runif(1,0,pi)
#and turn them into oscillations
x = xt(t)
y = yt(t)
z = zt(t)
#create values for colours normalised and related to x,y,z coordinates
cr = abs(z)/max(abs(z))
cg = abs(x)/max(abs(x))
cb = abs(y)/max(abs(y))
dat=data.frame(t, x, y, z, cr, cg ,cb)
#plot the black and white version
with(dat, scatterplot3d(x,y,z, pch=16,cex.symbols=0.25, axis=FALSE ))
with(dat, scatterplot3d(x,y,z, pch=16, color=rgb(cr,cg,cb),cex.symbols=0.25, axis=FALSE ))
#Set the stage for 3d plots
# clear scene:
clear3d("all")
# white background
bg3d(color="white")
#lights...camera...
light3d()
#action
# draw shperes in an rgl window
spheres3d(x, y, z, radius=0.025, color=rgb(cr,cg,cb))
#create animated gif (call to ImageMagic is automatic)
movie3d( spin3d(axis=c(0,0,1),rpm=5),fps=12, duration=12 )
#2d plots to give plan and elevation shots
plot(x,y,col=rgb(cr,cg,cb),cex=.05)
plot(y,z,col=rgb(cr,cg,cb),cex=.05)
plot(x,z,col=rgb(cr,cg,cb),cex=.05)

Beautiful Curves: The Harmonograph

Each of us has their own mappa mundi (Gala, my indispensable friend)

The harmonograph is a mechanism which, by means of several pendulums, draws trajectories that can be analyzed not only from a mathematical point of view but also from an artistic one. In its double pendulum version, one pendulum moves a pencil and the other one moves a platform with a piece of paper on it. You can see an example here. The harmonograph is easy to use: you only have to put pendulums into motion and wait for them to stop. The result are amazing undulating drawings like this one:

grafico0x2First harmonographs were built in 1857 by Scottish mathematician Hugh Blackburn, based on the previous work of French mathematician Jean Antoine Lissajous. There is not an unique way to describe mathematically the motion of the pencil. I have implemented the one I found in this sensational blog, where motion in both x and y axis depending on time is defined by:

<br /> x(t)=e^{-d_{1}t}sin(f_{1}t+p_{1})+e^{-d_{2}t}sin(f_{2}t+p_{2})\\<br /> y(t)=e^{-d_{3}t}sin(f_{3}t+p_{3})+e^{-d_{4}t}sin(f_{4}t+p_{4})<br />

I initialize parameters randomly so every time you run the script, you obtain a different output. Here is a mosaic with some of mine:
Collage3

This is the code to simulate the harmonograph (no extra package is required). If you create some nice work of art, I will be very happy to admire it (you can find my email here):

f1=jitter(sample(c(2,3),1));f2=jitter(sample(c(2,3),1));f3=jitter(sample(c(2,3),1));f4=jitter(sample(c(2,3),1))
d1=runif(1,0,1e-02);d2=runif(1,0,1e-02);d3=runif(1,0,1e-02);d4=runif(1,0,1e-02)
p1=runif(1,0,pi);p2=runif(1,0,pi);p3=runif(1,0,pi);p4=runif(1,0,pi)
xt = function(t) exp(-d1*t)*sin(t*f1+p1)+exp(-d2*t)*sin(t*f2+p2)
yt = function(t) exp(-d3*t)*sin(t*f3+p3)+exp(-d4*t)*sin(t*f4+p4)
t=seq(1, 100, by=.001)
dat=data.frame(t=t, x=xt(t), y=yt(t))
with(dat, plot(x,y, type="l", xlim =c(-2,2), ylim =c(-2,2), xlab = "", ylab = "", xaxt='n', yaxt='n'))