Facts are stubborn, but statistics are more pliable (Mark Twain)
According to World Health Organization, exclusive breastfeeding is recommended up to 6 months of age, with continued breastfeeding along with appropriate complementary foods up to two years of age or beyond. Thus, the defining characteristic of continued breastfeeding is that the infant between 6 months and 2 years of age receives at least some breast milk regardless of the quantity or the presence of other foods or liquids in the diet.
On the other hand, as can be read in The World Factbook of Central Intelligence Agency, the Total Fertility Rate (TFR) is the average number of children that would be born to a woman over her lifetime if she were to experience the exact current age-specific fertility rates through her lifetime and she were to survive from birth through the end of her reproductive life. It is obtained by summing the single-year age-specific rates at a given time.
This is how the world is arranged according to these two rates:
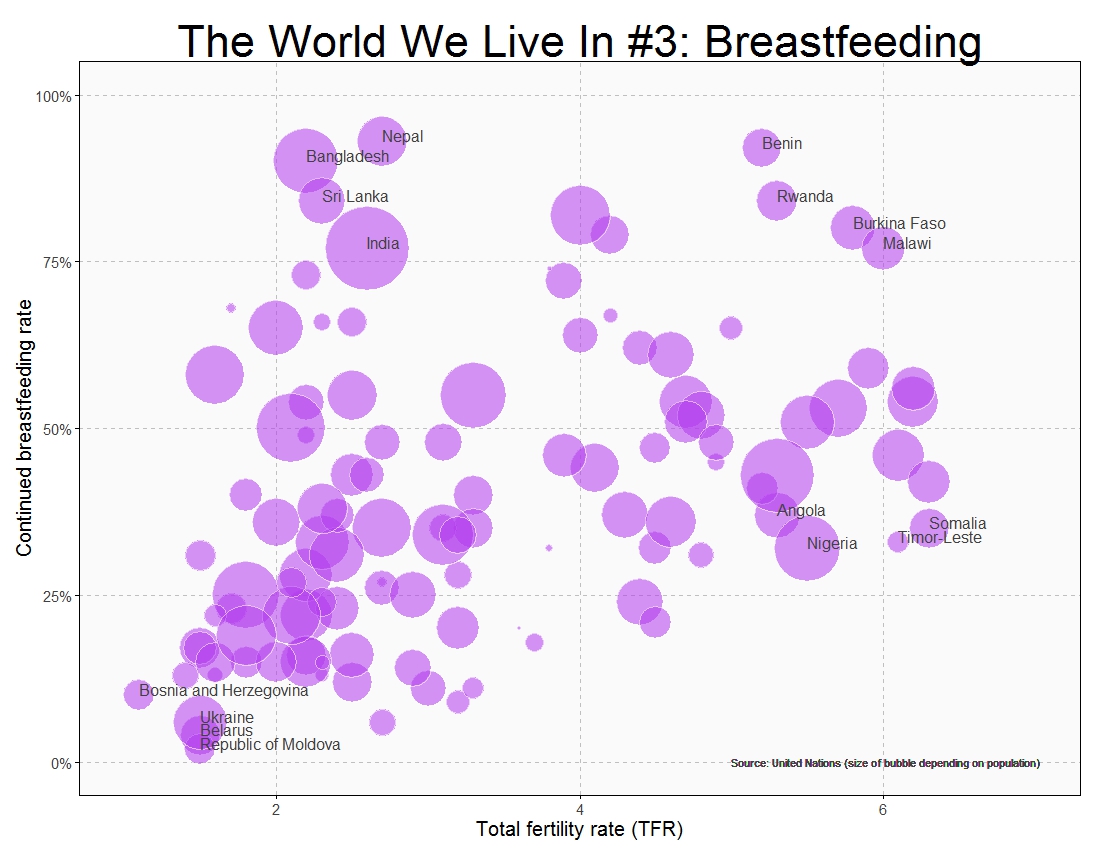 There are many differences between countries. Both rates are very low in some east European countries like Ukraine, Bosnia, Belarus and Moldova. On the other hand both of them are very high in Benin, Rwanda, Burkina Faso and Malawi, all of them African. Also African countries are Angola, Nigeria and Somalia where fertility rate is very high but breastfeeding is not very established (Timor-Leste in Asia belongs to this segment as well); and women in Nepal, Bangladesh, Sri-Lanka and India feed their moderate number of descendants with their own milk.
We live in a complex and beautiful world which cannot be measured only with averages nor standard deviations:
#Continued breastfeeding rate: http://data.un.org/Data.aspx?d=SOWC&f=inID%3a89
#Total fertility rate (TFR): http://data.un.org/Data.aspx?d=SOWC&f=inID%3a127
#Population: http://data.un.org/Data.aspx?d=SOWC&f=inID%3a105
require("sqldf")
require("ggplot2")
require("scales")
breastfeeding=read.csv("UNdata_Export_20141122_122134175.csv", nrows=124, header=T, row.names=NULL)
fertility=read.csv("UNdata_Export_20141122_122330581.csv", nrows=570, header=T, row.names=NULL)
population=read.csv("UNdata_Export_20141122_142359579.csv", nrows=999, header=T, row.names=NULL)
colnames(breastfeeding)[1]="Country"
colnames(fertility)[1]="Country"
colnames(population)[1]="Country"
data=sqldf("SELECT a.Country, a.Value as Pop, b.Value as Fertility, c.Value as Breastfeeding
           FROM population a inner join fertility b
           on (a.Country=b.Country) INNER JOIN breastfeeding c
           on (a.Country=c.Country)
           where a.Subgroup = 'Total' AND b.Year = 2011
           AND a.Country NOT IN ('World', 'South Asia',
           'Sub-Saharan Africa', 'Least Developed Countries/Territories', 'Eastern and Southern Africa',
           'East Asia and Pacific')")
opts=theme(
  panel.background = element_rect(fill="gray98"),
  panel.border = element_rect(colour="black", fill=NA),
  axis.line = element_line(size = 0.5, colour = "black"),
  axis.ticks = element_line(colour="black"),
  panel.grid.major = element_line(colour="gray75", linetype = 2),
  panel.grid.minor = element_blank(),
  axis.text.y = element_text(colour="gray25", size=15),
  axis.text.x = element_text(colour="gray25", size=15),
  text = element_text(size=20),
  legend.key = element_blank(),
  legend.position = "none",
  legend.background = element_blank(),
  plot.title = element_text(size = 45))
ggplot(data, aes(x=Fertility, y=Breastfeeding/100, size=log(Pop), label=Country), guide=FALSE)+
  geom_point(colour="white", fill="darkorchid2", shape=21, alpha=.55)+
  scale_size_continuous(range=c(2,40))+
  scale_x_continuous(limits=c(1,7))+
  scale_y_continuous(limits=c(0,1), labels = percent)+
  labs(title="The World We Live In #3: Breastfeeding",
       x="Total fertility rate (TFR)",
       y="Continued breastfeeding rate")+
  geom_text(data=subset(data, Fertility>5 & (Breastfeeding>75|Breastfeeding<40)), size=5.5, colour="gray25", hjust=0, vjust=0)+
  geom_text(data=subset(data, Fertility<3 & Breastfeeding>75), size=5.5, colour="gray25", hjust=0, vjust=0)+
  geom_text(data=subset(data, Fertility<2 & Breastfeeding<12), size=5.5, colour="gray25", hjust=0, vjust=0)+
  geom_text(aes(5, 0), colour="gray25", hjust=0, label="Source: United Nations (size of bubble depending on population)", size=4)+opts