Desde que te estoy queriendo
yo no sé lo que me pasa
cualquier vereda que tomo
siempre me lleva a tu casa
(Y mira que mira y mira, Camarón de la Isla)
The verses that head this post are taken from a song of Camarón de la Isla and illustrate very well what is a strange attractor in the real life. For non-Spanish speakers a translation is since I’m loving you, I don’t know what happens to me: any path I take, always ends at your house. If you don’t know who is Camarón de la Isla, hear his immense and immortal music.
I will not try to give here a formal definition of a strange attractor. Instead of doing it, I will try to describe them with my own words. A strange attractor can be defined with a system of equations (I don’t know if all strage attractors can be defined like this). These equations determine the trajectory of some initial point along a number of steps. The location of the point at step i, depends on the location of it at step i-1 so the trajectory is calculated sequentially. These are the equations that define the attractor of this experiment:
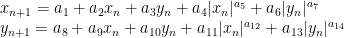
As you can see there are two equations, describing the location of each coordinate of the point (therefore it is located in a two dimensional space). These equations are impossible to resolve. In other words, you cannot know where will be the point after some iterations directly from its initial location. The adjective attractor comes from the fact of the trajectory of the point tends to be the same independently of its initial location.

Here you have more examples: folds, waterfalls, sand, smoke … images are really appealing:


The code of this experiment is here. You will find there a definition of parameters that produce a nice example image. Some comments:
- Each point depends on the previous one, so iteration is mandatory; since each plot involves 10 million points, a very good option to do it efficiently is to use
Rcpp, which allows you to iterate directly inC++. - Some points are quite isolated and far from the crowd of points. This is why I locate some breakpoints with
quantileto remove tails. If not, the plot may be reduced to a big point. - The key to obtain a nice plot if to find out a good set of parameters (a1 to a14). I have my own method, wich involves the following steps: generate a random value for each between -4 and 4, simulate a mini attractor of only 2000 points and keep it if it doesn’t diverge (i.e. points don’t go to infinite), if x and y are not correlated at all and its kurtosis is bigger than a certain thresold. If the mini attractor overcome these filters, I keep its parameters and generate the big version with 10 million points.
- I would have publish this method together with the code but I didn’t. Why? Because this may bring yourself to develop your own since mine one is not ideal. If you are interested in mine, let me know and I will give you more details. If you develop a good method by yourself and don’t mind to share it with me, let me know as well, please.
This post is inspired in this beautiful book from Julien Clinton Sprott. I would love to see your images.
These are really beautiful! Several of them seem reminiscent of Clifford attractors that you wrote about a year or so ago.
Nice to see the reference to Clint Sprott. He is such a landmark figure in chaos and complex systems research.
Yes, that’s true. I love his book. Thank you.
Hi,
I was wondering if the coefficient (a) has any meaning to it. For example could a1-a14 use a dataset containing 14 numbers that would come to be represented in the plot? For example yearly precipitation by percentage (a1=0.83, a2-0,61…..) Would the resulting plot have any meaning communicated by the dataset?