Lesson learned, and the wheels keep turning (The Killers – The world we live in)
I discovered this site with a huge amount of data waiting to be analyzed. The first thing I’ve done is this simple graph, where you can see relationship between cellular subscribers and obese people. Bubbles are countries and its size depends on the population:
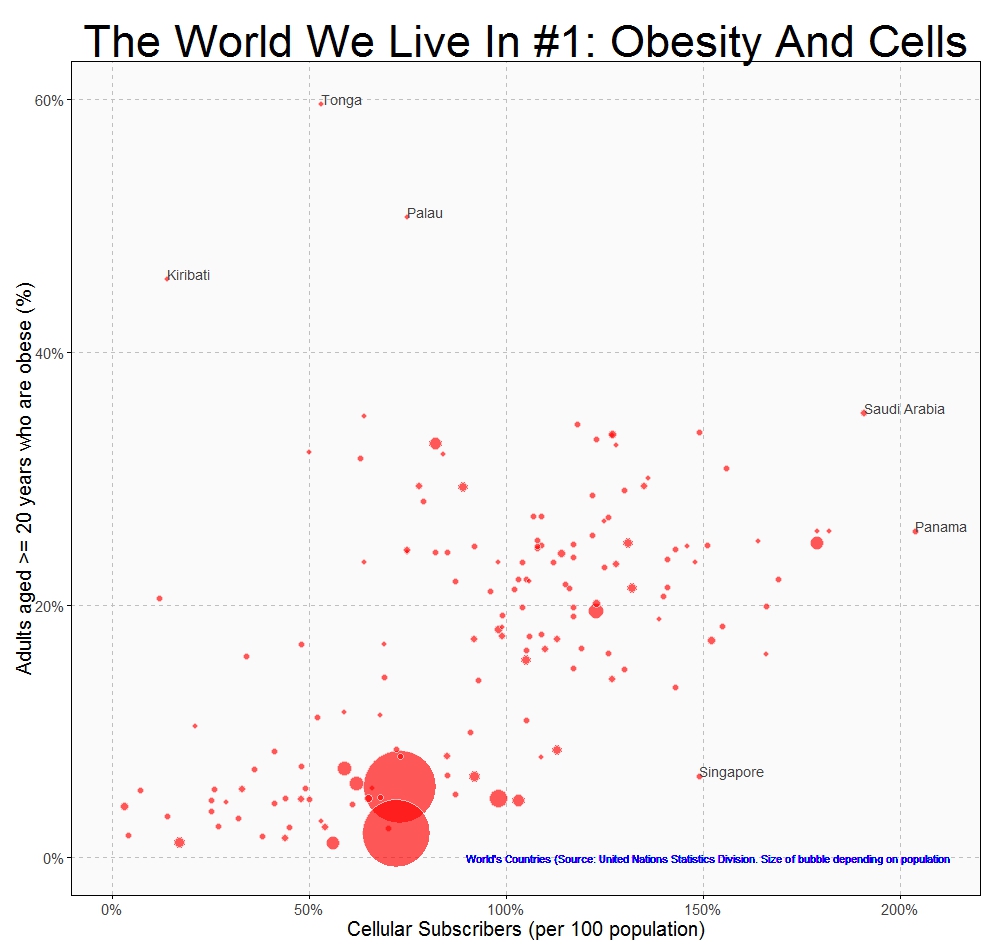
Some quick conclusions:
- The more cellular subscribers, the more obese people
- Pacific islands such as Kiribati, Palau and Tonga are plenty of happy people
- Singapore people are thinner than they should be
- How do Saudi Arabian and Panamanian manage two cellulars?
This is the world we live in.
cellular  =read.csv("UNdata_Export_20140930_cellular.csv",   nrows=193,   header=T, row.names=NULL)
obese     =read.csv("UNdata_Export_20140930_obese.csv",      nrows=567,   header=T, row.names=NULL)
population=read.csv("UNdata_Export_20140930_population.csv", nrows=12846, header=T, row.names=NULL)
require("sqldf")
require("plyr")
population=rename(population, replace = c("Country.or.Area" = "Country"))
population=sqldf("SELECT a.Country, a.Year, a.Value as Population
FROM population a INNER JOIN (SELECT Country, MAX(Year) AS Year FROM population GROUP BY 1) b
      ON (a.Country=b.Country AND a.Year=b.Year)")
cellular=rename(cellular, replace = c("Country.or.Area" = "Country"))
cellular=rename(cellular, replace = c("Value" = "Cellular"))
obese=rename(obese, replace = c("Country.or.Area" = "Country"))
obese=rename(obese, replace = c("Year.s." = "Year"))
obese=sqldf("SELECT a.Country, a.Year, SUBSTR(TRIM(Value), 1, CHARINDEX(' [', TRIM(Value))) as Obeses
FROM obese a INNER JOIN (SELECT Country, MAX(Year) AS Year FROM obese WHERE GENDER='Both sexes' GROUP BY 1) b
ON (a.Country=b.Country AND a.Year=b.Year AND a.GENDER='Both sexes')")
obese$Obeses=as.numeric(obese$Obeses)
data=sqldf("SELECT a.Country, a.Cellular, c.Obeses, b.Population FROM cellular a inner join population b on a.Country = b.Country
      inner join obese c on (a.Country = c.Country) WHERE a.Country NOT IN ('World', 'South Asia')")
require(ggplot2)
require(scales)
opts=theme(
  panel.background = element_rect(fill="gray98"),
  panel.border = element_rect(colour="black", fill=NA),
  axis.line = element_line(size = 0.5, colour = "black"),
  axis.ticks = element_line(colour="black"),
  panel.grid.major = element_line(colour="gray75", linetype = 2),
  panel.grid.minor = element_blank(),
  axis.text.y = element_text(colour="gray25", size=15),
  axis.text.x = element_text(colour="gray25", size=15),
  text = element_text(size=20),
  legend.key = element_blank(),
  legend.position = "none",
  legend.background = element_blank(),
  plot.title = element_text(size = 45)
    )
ggplot(data, aes(x=Cellular/100, y=Obeses/100, size=Population, label=Country), guide=FALSE)+
  geom_point(colour="white", fill="red", shape=21, alpha=.65)+
  scale_size_continuous(range=c(3,35))+
  scale_x_continuous(limits=c(0,2.1), labels = percent)+
  scale_y_continuous(limits=c(0,.6), labels = percent)+
  labs(title="The World We Live In #1: Obesity And Cells",
       x="Cellular Subscribers (per 100 population)",
       y="Adults aged >= 20 years who are obese (%)")+
  geom_text(data=subset(data, Cellular/100 > 1.9 | Obeses/100 > .4 | (Cellular/100 > 1.4 & Obeses/100 < .15)), size=5, colour="gray25", hjust=0, vjust=0)+
  geom_text(aes(.9, .0), colour="blue", hjust=0, label="World's Countries (Source: United Nations Statistics Division. Size of bubble depending on population", size=4)+
  opts
Hi Antonio,
You can find similar curated data here:
http://www.gapminder.org/data/
And besides ggplot2 you can use (even to include in your blog) animated charts based on googleVis package.
Thanks! I will try to use all these resources in the future
Such a discovery googleVis package! I will use for sure, beginning for solving a problem I have actually in my work! Thanks a lot 🙂
Which UN dataset are using to create the csvs?
Cellular subs. –> http://data.un.org/Data.aspx?q=cellular+subscribers&d=SOWC&f=inID%3a203
Obesity –> http://data.un.org/Data.aspx?q=obese&d=WHO&f=MEASURE_CODE%3aWHOSIS_000010
Population –> http://data.un.org/Data.aspx?d=SOWC&f=inID%3a105
Thank you!