Technology is just a tool: in terms of getting the kids working together and motivating them, the teacher is the most important (Bill Gates)
Some days ago I read this article in R-bloggers and I discovered the TurtleGraphics package. I knew about turtle graphics long time ago and I was thinking of writing a post about them, doing some draw on my own using this technique. In fact, some of my previous drawings could have been done using this package.
Turtle graphics are a good tool to teach kids some very important mathematical and computational concepts such as length, coordinates, location, angles, iterations … Small changes in some of this parameters (especially in angles) can produce very different drawings. Those who want to know more about turtle graphics can read the Wikipedia article.
Following you can find four simple graphics preceded by the code to generate them. Please, send me your creations if you want:
library(TurtleGraphics)
turtle_init()
turtle_col("gray25")
for (i in 1:150) {
  turtle_forward(dist=1+0.5*i)
  turtle_right(angle=89.5)}
turtle_hide()

library(TurtleGraphics)
turtle_init()
turtle_col("gray25")
turtle_right(angle=234)
for (i in 1:100) {
  turtle_forward(dist=0.9*i)
  turtle_right(angle=144.3)}
turtle_hide()

library(TurtleGraphics)
turtle_init()
turtle_col("gray25")
turtle_setpos(48,36)
d=50
for (i in 1:300) {
  turtle_forward(dist=d)
  if (i%%4==0) {
    turtle_right(angle=75)
    d=d*.95}
else turtle_right(angle=90)}
turtle_hide()
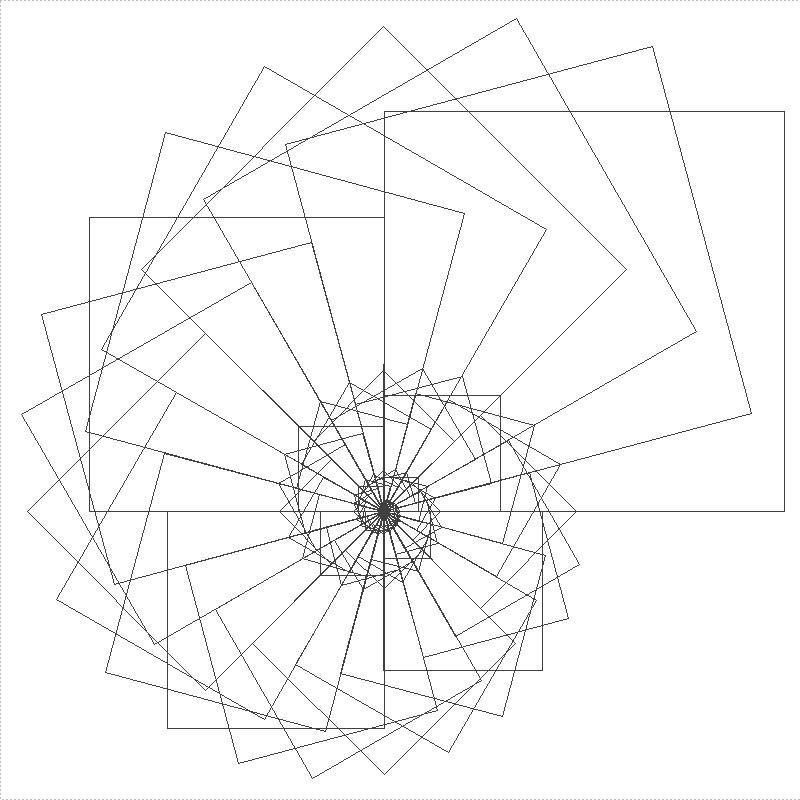
library(TurtleGraphics)
turtle_init()
turtle_col("gray25")
turtle_setpos(50,35)
turtle_right(angle=30)
d=25
turtle_setpos(50-d/2,50-d/2*tan(pi/6))
for (i in 1:100) {
  turtle_forward(dist=d)
  d=d+.5
  turtle_right(angle=120+1)}
turtle_hide()
