I was getting ready for school and about to wear my uniform when I remembered that our principal had told us not to wear uniforms. So I decided to wear my favorite pink dress (Malala Yousafzai)
After reading the diary of a Pakistani schoolgirl and Malala’s history, there is no doubt of being in front of a brave girl. A girl that will fight against monsters who deprive children of their childhood. A girl who knows that one book, one pen, one child and one teacher can change this unfair world. A girl who knew she had won the Nobel Prize of Peace in her chemistry lesson and finished the school time before making her first statement. A girl for whom the prize is just the beginning: a girl that gives us hope. Long live Malala:
To know where to obtain data for this plot, check out this post. This is the code:
require("sqldf")
require("plyr")
require("stringdist")
childlabour=read.csv("UNdata_Export_20141013_ChildLabour.csv", nrows=335, header=T, row.names=NULL)
education=read.csv("UNdata_Export_20141013_Education.csv", nrows=2994, header=T, row.names=NULL)
population =read.csv("UNdata_Export_20140930_Population.csv", nrows=12846, header=T, row.names=NULL)
population=rename(population, replace = c("Country.or.Area" = "Country"))
education=rename(education, replace = c("Reference.Area" = "Country"))
education=rename(education, replace = c("Time.Period" = "Year"))
childlabour=rename(childlabour, replace = c("Country.or.Area" = "Country"))
population=sqldf("SELECT a.Country, a.Year, a.Value as Pop
FROM population a INNER JOIN (SELECT Country, MAX(Year) AS Year FROM population GROUP BY 1) b
ON (a.Country=b.Country AND a.Year=b.Year)
WHERE (a.Country NOT LIKE '%INCOME%')
AND (a.Country NOT LIKE '%WORLD%')
AND (a.Country NOT LIKE '%developing%')
AND (a.Country NOT LIKE '%OECD%')
AND (a.Country NOT LIKE '%countries%')
AND (a.Country NOT LIKE '%South Asia%')
AND (a.Country NOT LIKE '%Small states%')
AND (a.Country NOT LIKE '%Euro area%')
AND (a.Country NOT LIKE '%European Union%')
AND (a.Country NOT LIKE '%North America%')")
childlabour=sqldf("SELECT * FROM childlabour WHERE Subgroup='Total 5-14 yr'")
education=sqldf("SELECT a.* FROM education a INNER JOIN (SELECT Country, MAX(Year) AS Year FROM education GROUP BY 1) b
ON (a.Country=b.Country AND a.Year=b.Year)")
data=sqldf("SELECT a.Country, a.Pop, b.Value as ChildLabour, c.Observation_Value as Education
FROM
population a INNER JOIN childlabour b
ON (a.Country=b.Country) INNER JOIN education c
ON (a.Country=c.Country)")
require(ggplot2)
require(scales)
opts=theme(
panel.background = element_rect(fill="gray98"),
panel.border = element_rect(colour="black", fill=NA),
axis.line = element_line(size = 0.5, colour = "black"),
axis.ticks = element_line(colour="black"),
panel.grid.major = element_line(colour="gray75", linetype = 2),
panel.grid.minor = element_blank(),
axis.text.y = element_text(colour="gray25", size=15),
axis.text.x = element_text(colour="gray25", size=15),
text = element_text(size=20),
legend.key = element_blank(),
legend.position = "none",
legend.background = element_blank(),
plot.title = element_text(size = 45)
)
ggplot(data, aes(x=ChildLabour/100, y=Education/100, size=log(Pop), label=Country), guide=FALSE)+
geom_point(colour="white", fill="red", shape=21, alpha=.55)+
scale_size_continuous(range=c(2,40))+
scale_x_continuous(limits=c(0,.5), labels = percent)+
scale_y_continuous(limits=c(0,.12), labels = percent)+
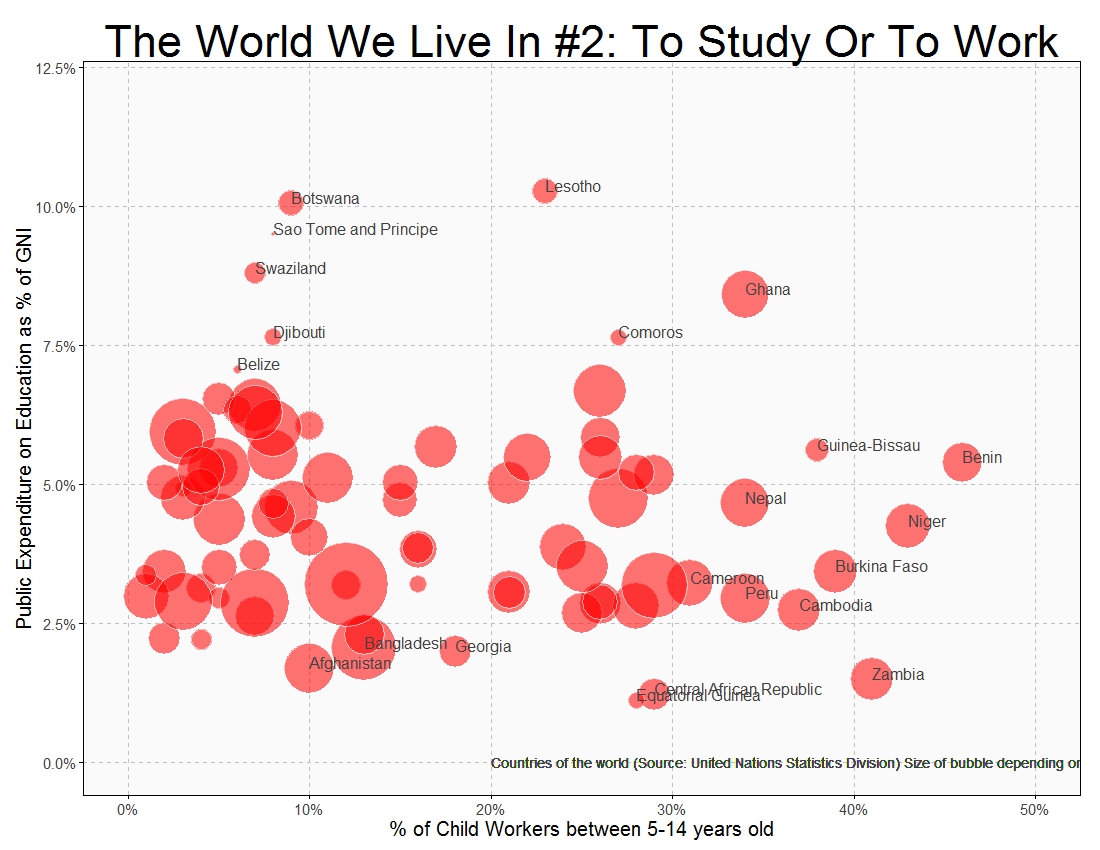
labs(title="The World We Live In #2: To Study Or To Work",
x="% of Child Workers between 5-14 years old",
y="Public Expenditure on Education as % of GNI")+
geom_text(data=subset(data, ChildLabour/100>.3 | Education/100>.07| Education/10<.022), size=5.5, colour="gray25", hjust=0, vjust=0)+
geom_text(aes(.2, .0), colour="gray25", hjust=0, label="Countries of the world (Source: United Nations Statistics Division) Size of bubble depending on population", size=5)+
opts